POLS 6386 MEASUREMENT THEORY
Fifth Assignment
Due 7 March 2001
WALLACE 1 1.0000 HUMPHREY 2 -0.3108 1.0000 NIXON 3 0.0169 -0.2011 1.0000 MCCARTHY 4 -0.1283 0.2449 0.0779 1.0000 REAGAN 5 0.2054 -0.1824 0.4331 0.1073 1.0000 ROCKEFELLER 6 -0.1517 0.1614 0.1232 0.3304 0.1941 1.0000 LBJ 7 -0.2290 0.7251 -0.1248 0.1276 -0.1089 0.1621 1.0000 ROMNEY 8 -0.0568 0.1755 0.2419 0.3390 0.3120 0.3361 0.2386 1.0000 R.KENNEDY 9 -0.2427 0.5658 -0.1629 0.3371 -0.1193 0.2323 0.5035 0.2582 1.0000 MUSKIE 10 -0.2546 0.5791 -0.1093 0.2955 -0.0717 0.2759 0.4676 0.2537 0.4349 1.0000 AGNEW 11 0.1514 -0.1168 0.6153 0.1299 0.4522 0.1323 -0.0492 0.3432 -0.0302 -0.0374 1.0000 LEMAY 12 0.6731 -0.2144 0.1604 -0.0203 0.2822 -0.0477 -0.0887 0.1077 -0.1269 -0.1643 0.3328 1.0000
SEN90KH.ORD NON-PARAMETRIC MULTIDIMENSIONAL UNFOLDING 1 596 10 19 1 4 20 0.025 3 (3X,9A1,7X,4A1,2X,6A1,5X,1600I1) (I5,1X,19A1,2I5,50F8.3)The "1" in the 3rd row is the number of dimensions. In the output file PERF23.DAT you will find the eigenvalues of the double-centered squared distance matrix formed from the agreement scores. Below is what these look like for the 100th Senate. The column headed by "6.1684" are the eigenvalues. Graph these in the same fashion using Excel as you did for homework 3.
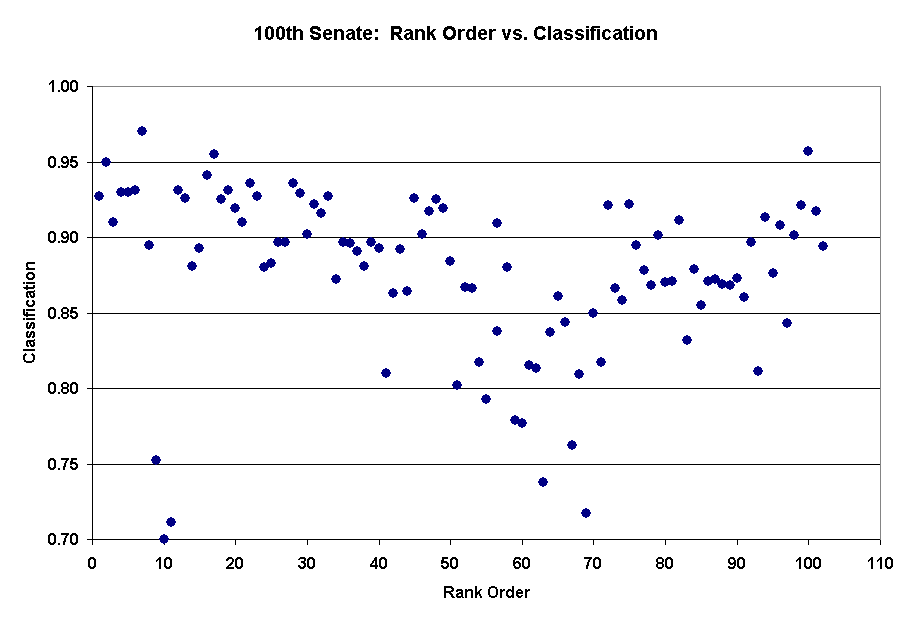
PERFORMANCE INDEX EIGENVALUE/VECTOR ROUTINE= 1 102 0 0 PERFORMANCE INDEX EIGENVALUE/VECTOR ROUTINE= 1 102 0 0 1 6.1684 50.0408 50.0408 6.3530 35.4969 35.4969 2 0.7269 5.8968 55.9376 1.1253 6.2875 41.7844 3 0.4319 3.5042 59.4418 0.6667 3.7250 45.5093 4 0.3564 2.8912 62.3330 0.4909 2.7431 48.2524 5 0.2792 2.2650 64.5980 0.4092 2.2866 50.5390 6 0.2445 1.9831 66.5812 0.3824 2.1369 52.6759 7 0.2015 1.6349 68.2160 0.3442 1.9233 54.5991 8 0.1705 1.3833 69.5994 0.3012 1.6827 56.2819 9 0.1254 1.0173 70.6166 0.2887 1.6131 57.8950 10 0.1151 0.9341 71.5507 0.2622 1.4650 59.3599Use Excel to graph the estimated rank ordering of the Senators against the proportion of roll call choices that are correctly classified. These are the last two columns of PERF25.DAT (see the example in homework 3). The graph for the 100th Senate is below. Save the one dimensional output files!
27 FEBRUARY 2001 13.27.23.43. 1 9990799 0 200REAGAN 10 122 0.918 0.009 0.813 0.560 2 1465941 0 100SHELBY 52 625 0.917 0.002 -0.012 -0.705 3 1470541 0 100HEFLIN 47 628 0.925 0.002 0.054 -0.822 4 1490781 0 200MURKOW 69 578 0.881 0.005 0.345 0.132 5 1210981 0 200STEVEN 90 600 0.850 0.002 0.225 0.204 6 1503961 0 200MCCAIN 78 598 0.870 0.010 0.387 0.101 7 1450261 0 100DECONC 92 620 0.852 0.002 -0.110 -0.448 8 1079142 0 100PRYOR, 42 603 0.930 0.002 -0.255 -0.185 9 1430042 0 100BUMPER 55 605 0.909 0.003 -0.283 -0.146 10 1491571 0 200WILSON 96 583 0.835 0.002 0.324 0.232 etc. etc.The column headed by "0.918" is the proportion correctly classified. Note that this is computed from the two columns just preceding it:
One Dimension Scalings PERF 1d KYST 1d WNOM 1d ------------------------------------------------ PERF 1d 1 KYST 1d -0.92682 1 WNOM 1d -0.95408 0.990908 1 Two Dimensional Scalings 1 PERF 2d 1 KYST 2d 1 WNOM 2d ------------------------------------------------- 1 PERF 2d 1 1 KYST 2d 0.99034 1 1 WNOM 2d 1 0.99034 1 2 PERF 2d 2 KYST 2d 2 WNOM 2d ------------------------------------------------- 2 PERF 2d 1 2 KYST 2d 0.592688 1 2 WNOM 2d 1 0.592688 1 etc.