-
Paste the dataset into EVIEWS and call it
HDMG105Z.WF1. Recall that HDMG105Y.WF1 has a big outlier and that we discussed it in class.
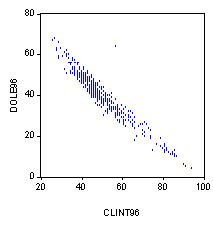
Specifically, below are the results of:
SCAT CLINT96 DOLE96

using HDMG105Y.WF1. Explain how you would use EVIEWS commands to find the outlier. Give the commands exactly as you would type them in along with a commentary on the results. Tell me the exact data error and verify that it is corrected in HDMG105Z.DTA/HDMG105Z.WF1. Turn in the corresponding SCAT CLINT96 DOLE96 command for HDMG105Z.WF1.
Recall that dwnom1 is a measure of economic liberalism/conservatism of the member of Congress and it ranges from -1 (liberal) to +1 (conservative). In EVIEWS regress the following variables on dwnom1: black, hisp, income, rep, female, aamer, and himem. Namely:
LS dwnom1 C black hisp income rep female aamer himem
Do the results make sense to you? Explain your answer.
Look at the distribution of the error terms with the HIST command; namely:
HIST RESID
Interpret the results (be specific!).
On the toolbar of the regression table that you just ran there is a button labeled "Forecast". Click on that button and then click on "OK". This creates the y-hat's using the vector dwnom1f. On the toolbar of the graph that comes up showing the y-hat's is a button labeled "Resids". Click on that button and you will see a plot of the residuals. Note that the residuals are plotted in order of observation. Use the SHOW command to find the large residuals; specifically:
show resid dwnom1 dwnom1f black hisp income rep female aamer himem
There are three residuals larger than 0.45 and one smaller than -.4. Find them and report the observation number and the value of the residual.
Create a new variable that contains the residuals:
GENR cheatresid=resid
Now, edit cheatresid and set the four large residuals to zero. To do this first enter the command:
SHOW cheatresid
and then click on "Edit+/-" button on the toolbar. This allows you to make changes in cheatresid. Replace the four large residuals with zeroes and enter the command:
HIST cheatresid
What has changed? Be specific.
Go into STATA, open the data editor, and look at the observations corresponding to the four residuals. Report the name of the member of the House, the State, congressional district, and political party. What do the representatives corresponding to the three large postive residuals have in common?
-
Replicate the analyses performed in Epple Notes V-3 to
V-7. Note that the WALD test discussed on V-3 to V-7 can also be performed using the
"view" button as described in Epple Notes IV-18 to IV-19.
Perform the Wald Test:
bnicot = bweight = 0
Answer the question on page V-7 of the Epple Notes.
Find the eigenvalues of the correlation matrix of nicotine, tar, and weight. Use the method shown in 3.c. of the 2nd homework.
Interpret the pattern of the eigenvalues. What do you think is the best specification to predit carbon monoxide?