============================================================
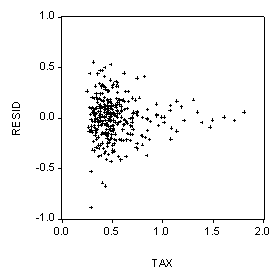
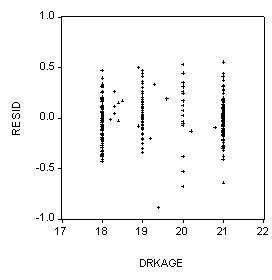
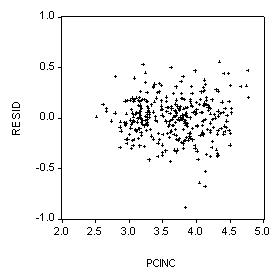
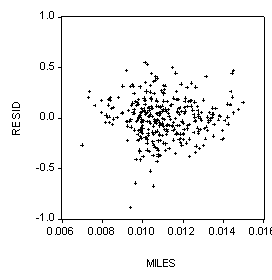
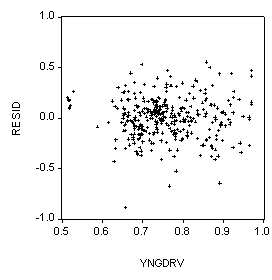
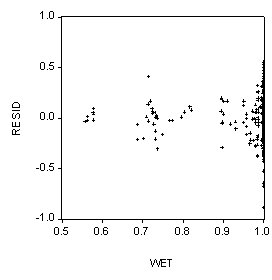
White Heteroskedasticity Test:
============================================================
F-statistic          2.872725    Probability        0.000038
Obs*R-squared        54.15035    Probability        0.000094
============================================================

Test Equation:
LS // Dependent Variable is RESID^2
Date: 04/21/98   Time: 13:03
Sample: 1 336
Included observations: 336
============================================================
      Variable      CoefficienStd. Errort-Statistic  Prob.
============================================================
         C          -5.273037   1.975978  -2.668570   0.0080
        TAX          0.004902   0.076273   0.064269   0.9488
       TAX^2        -0.014658   0.040564  -0.361361   0.7181
       DRKAGE        0.562102   0.206821   2.717822   0.0069
      DRKAGE^2      -0.014380   0.005285  -2.720967   0.0069
       PCINC        -0.074213   0.146670  -0.505982   0.6132
      PCINC^2        0.009711   0.019575   0.496121   0.6202
       MILES         94.47385   36.46556   2.590769   0.0100
      MILES^2       -3898.757   1599.262  -2.437848   0.0153
       YNGDRV       -1.304460   0.694870  -1.877270   0.0614
      YNGDRV^2       0.965221   0.462340   2.087686   0.0376
        INSP         0.004712   0.009554   0.493171   0.6222
       MORMON       -0.677308   0.233042  -2.906385   0.0039
      MORMON^2       0.727000   0.321472   2.261470   0.0244
        PROT        -0.260051   0.236303  -1.100500   0.2720
       PROT^2        0.090228   0.418702   0.215494   0.8295
        CATH        -0.312100   0.129396  -2.411972   0.0164
       CATH^2        0.521536   0.192144   2.714302   0.0070
       SOBAB        -0.533068   0.217292  -2.453235   0.0147
      SOBAB^2        1.122543   0.920530   1.219453   0.2236
        WET         -0.116754   0.847227  -0.137807   0.8905
       WET^2         0.086463   0.522267   0.165553   0.8686
============================================================
R-squared            0.161162    Mean dependent var 0.040846
Adjusted R-squared   0.105061    S.D. dependent var 0.072709
S.E. of regression   0.068783    Akaike info criter-5.290355
Sum squared resid    1.485577    Schwarz criterion -5.040425
Log likelihood       434.0164    F-statistic        2.872725
Durbin-Watson stat   1.896893    Prob(F-statistic)  0.000038
============================================================
LS(H) LFT18T20 C TAX DRKAGE PCINC MILES YNGDRV INSP MORMON PROT CATH SOBAB WET
============================================================
LS // Dependent Variable is LFT18T20
Date: 04/21/98   Time: 13:07
Sample: 1 336
Included observations: 336
White Heteroskedasticity-Consistent Standard Errors &
        Covariance
============================================================
      Variable      CoefficienStd. Errort-Statistic  Prob.
============================================================
         C           3.165057   0.293886   10.76969   0.0000
        TAX         -0.278794   0.045943  -6.068288   0.0000
       DRKAGE       -0.035408   0.008922  -3.968661   0.0001
       PCINC        -0.195457   0.039210  -4.984835   0.0000
       MILES         110.1364   8.881711   12.40036   0.0000
       YNGDRV        1.524236   0.161228   9.453931   0.0000
        INSP        -0.075403   0.026855  -2.807803   0.0053
       MORMON       -0.814448   0.137447  -5.925542   0.0000
        PROT        -0.712803   0.143324  -4.973384   0.0000
        CATH        -0.504089   0.160777  -3.135327   0.0019
       SOBAB        -0.707793   0.244949  -2.889549   0.0041
        WET          0.424073   0.106305   3.989223   0.0001
============================================================
R-squared            0.570763    Mean dependent var 4.025630
Adjusted R-squared   0.556190    S.D. dependent var 0.308939
S.E. of regression   0.205812    Akaike info criter-3.126519
Sum squared resid    13.72424    Schwarz criterion -2.990194
Log likelihood       60.49186    F-statistic        39.16620
Durbin-Watson stat   1.156329    Prob(F-statistic)  0.000000
============================================================
LS(WT=WEIGHT) LFT18T20 C TAX DRKAGE PCINC MILES YNGDRV INSP MORMON PROT
CATH SOBAB WET
============================================================
LS // Dependent Variable is LFT18T20
Date: 04/21/98   Time: 13:10
Weighting series: WEIGHT
Sample: 1 336
Included observations: 336
============================================================
      Variable      CoefficienStd. Errort-Statistic  Prob.
============================================================
         C           3.222418   0.337739   9.541154   0.0000
        TAX         -0.274002   0.067616  -4.052302   0.0001
       DRKAGE       -0.035095   0.009525  -3.684584   0.0003
       PCINC        -0.196498   0.035992  -5.459494   0.0000
       MILES         106.9708   9.091373   11.76618   0.0000
       YNGDRV        1.486685   0.151822   9.792312   0.0000
        INSP        -0.076806   0.026530  -2.895037   0.0040
       MORMON       -0.804665   0.148464  -5.419917   0.0000
        PROT        -0.687807   0.146028  -4.710117   0.0000
        CATH        -0.523134   0.129111  -4.051817   0.0001
       SOBAB        -0.701809   0.247495  -2.835654   0.0049
        WET          0.422053   0.184489   2.287683   0.0228
============================================================
Weighted Statistics
============================================================
R-squared            0.166752    Mean dependent var 4.018315
Adjusted R-squared   0.138463    S.D. dependent var 0.221887
S.E. of regression   0.205953    Akaike info criter-3.125154
Sum squared resid    13.74299    Schwarz criterion -2.988829
Log likelihood       60.26252    F-statistic        5.894548
Durbin-Watson stat   1.167913    Prob(F-statistic)  0.000000
============================================================
Unweighted Statistics
============================================================
R-squared            0.570406    Mean dependent var 4.025630
Adjusted R-squared   0.555821    S.D. dependent var 0.308939
S.E. of regression   0.205898    Sum squared resid  13.73565
Durbin-Watson stat   1.151230
============================================================
Auto Correlation Examples-
The first example is first-order autocorrelation with parameter .5. The
true values for the intercept and slope are both equal to 2. The first
output is for a simple two variable regression. Note the value for the
Durban-Watson statistic and remember that the estimators are unbiased. The
ordinary regression works well here because of low error and a large sample
size.
============================================================
LS // Dependent Variable is YYY
Date: 04/18/98   Time: 14:38
Sample(adjusted): 2 500
Included observations: 499 after adjusting endpoints
============================================================
      Variable      CoefficienStd. Errort-Statistic  Prob.
============================================================
         C           2.039942   0.055456   36.78497   0.0000
         X           2.019524   0.053867   37.49101   0.0000
============================================================
R-squared            0.738775    Mean dependent var 2.100864
Adjusted R-squared   0.738250    S.D. dependent var 2.420290
S.E. of regression   1.238258    Akaike info criter 0.431411
Sum squared resid    762.0415    Schwarz criterion  0.448295
Log likelihood      -813.6873    F-statistic        1405.576
Durbin-Watson stat   0.850402    Prob(F-statistic)  0.000000
============================================================
Given the value of the Durban-Watson statistic, the first step is to try estimating the
first-order autocorrelation model. To do this in EVIEWS, use the command:LS YYY C X AR(1)
The Durban-Watson is now near 2 indicating that our correction has done the trick. Also note that the standard errors are now smaller.
============================================================
LS // Dependent Variable is YYY
Date: 04/18/98   Time: 14:47
Sample(adjusted): 3 500
Included observations: 498 after adjusting endpoints
Convergence achieved after 4 iterations
============================================================
      Variable      CoefficienStd. Errort-Statistic  Prob.
============================================================
         C           2.029702   0.107408   18.89720   0.0000
         X           1.976182   0.037777   52.31180   0.0000
       AR(1)         0.576651   0.036850   15.64846   0.0000
============================================================
R-squared            0.823824    Mean dependent var 2.090885
Adjusted R-squared   0.823113    S.D. dependent var 2.412425
S.E. of regression   1.014617    Akaike info criter 0.035029
Sum squared resid    509.5768    Schwarz criterion  0.060394
Log likelihood      -712.3535    F-statistic        1157.349
Durbin-Watson stat   2.029978    Prob(F-statistic)  0.000000
============================================================
Inverted AR Roots          .58
============================================================
As a further check, we can run higher order AR models. For example, to add
a second-order autocorrelation issue the EVIEWS command:LS YYY C X AR(1) AR(2)
============================================================
LS // Dependent Variable is YYY
Date: 04/18/98   Time: 14:51
Sample(adjusted): 4 500
Included observations: 497 after adjusting endpoints
Convergence achieved after 4 iterations
============================================================
      Variable      CoefficienStd. Errort-Statistic  Prob.
============================================================
         C           2.026031   0.111789   18.12370   0.0000
         X           1.981206   0.038435   51.54703   0.0000
       AR(1)         0.552113   0.045357   12.17258   0.0000
       AR(2)         0.040334   0.045379   0.888813   0.3745
============================================================
R-squared            0.824106    Mean dependent var 2.093776
Adjusted R-squared   0.823036    S.D. dependent var 2.413992
S.E. of regression   1.015496    Akaike info criter 0.038769
Sum squared resid    508.3972    Schwarz criterion  0.072641
Log likelihood      -710.8467    F-statistic        769.9438
Durbin-Watson stat   1.974323    Prob(F-statistic)  0.000000
============================================================
Inverted AR Roots          .6      -.07
============================================================
To add a second-order and third-order autocorrelation terms issue the EVIEWS
command:LS YYY C X AR(1) AR(2) AR(3)
============================================================
LS // Dependent Variable is YYY
Date: 04/18/98   Time: 14:54
Sample(adjusted): 5 500
Included observations: 496 after adjusting endpoints
Convergence achieved after 4 iterations
============================================================
      Variable      CoefficienStd. Errort-Statistic  Prob.
============================================================
         C           2.033835   0.110996   18.32347   0.0000
         X           1.981932   0.038471   51.51745   0.0000
       AR(1)         0.554496   0.045383   12.21827   0.0000
       AR(2)         0.050379   0.052013   0.968582   0.3332
       AR(3)        -0.015515   0.045462  -0.341276   0.7330
============================================================
R-squared            0.824542    Mean dependent var 2.099213
Adjusted R-squared   0.823113    S.D. dependent var 2.413381
S.E. of regression   1.015019    Akaike info criter 0.039843
Sum squared resid    505.8590    Schwarz criterion  0.082248
Log likelihood      -708.6746    F-statistic        576.8487
Durbin-Watson stat   1.979999    Prob(F-statistic)  0.000000
============================================================
Inverted AR Roots          .6       .14       -.18
============================================================
This second example is a two variable model with
first and second-order autocorrelation. The intercept and slope are both
equal to 2.0 and the autocorrelation parameters are .5 and .3 respectively.
Again, start with the simple linear regression. Note that the Durban-Watson is quite small so that the next thing we should try is estimating simple first-order autocorrelation.
============================================================
LS // Dependent Variable is YYYY
Date: 04/18/98   Time: 14:57
Sample: 1 500
Included observations: 500
============================================================
      Variable      CoefficienStd. Errort-Statistic  Prob.
============================================================
         C           2.127447   0.074982   28.37268   0.0000
         X           2.089195   0.072906   28.65600   0.0000
============================================================
R-squared            0.622489    Mean dependent var 2.189925
Adjusted R-squared   0.621731    S.D. dependent var 2.724954
S.E. of regression   1.675945    Akaike info criter 1.036746
Sum squared resid    1398.778    Schwarz criterion  1.053604
Log likelihood      -966.6557    F-statistic        821.1663
Durbin-Watson stat   0.463438    Prob(F-statistic)  0.000000
============================================================
First, try estimating first-order autocorrelation.
============================================================
LS // Dependent Variable is YYYY
Date: 04/18/98   Time: 14:59
Sample(adjusted): 2 500
Included observations: 499 after adjusting endpoints
Convergence achieved after 4 iterations
============================================================
      Variable      CoefficienStd. Errort-Statistic  Prob.
============================================================
         C           2.091612   0.214367   9.757170   0.0000
         X           1.973435   0.036009   54.80381   0.0000
       AR(1)         0.777316   0.028582   27.19551   0.0000
============================================================
R-squared            0.847857    Mean dependent var 2.187698
Adjusted R-squared   0.847244    S.D. dependent var 2.727233
S.E. of regression   1.065914    Akaike info criter 0.133659
Sum squared resid    563.5415    Schwarz criterion  0.158985
Log likelihood      -738.3982    F-statistic        1382.045
Durbin-Watson stat   2.448294    Prob(F-statistic)  0.000000
============================================================
Inverted AR Roots          .78
============================================================
Note that the
Durban-Watson is somewhat high. This is suspicious so the next step is to try
estimating the model with second-order autocorrelation.
============================================================
LS // Dependent Variable is YYYY
Date: 04/18/98   Time: 15:01
Sample(adjusted): 3 500
Included observations: 498 after adjusting endpoints
Convergence achieved after 5 iterations
============================================================
      Variable      CoefficienStd. Errort-Statistic  Prob.
============================================================
         C           2.062221   0.296098   6.964657   0.0000
         X           2.002662   0.037604   53.25624   0.0000
       AR(1)         0.537732   0.043203   12.44650   0.0000
       AR(2)         0.308084   0.043190   7.133140   0.0000
============================================================
R-squared            0.860985    Mean dependent var 2.177893
Adjusted R-squared   0.860141    S.D. dependent var 2.721157
S.E. of regression   1.017651    Akaike info criter 0.042993
Sum squared resid    511.5928    Schwarz criterion  0.076813
Log likelihood      -713.3367    F-statistic        1019.860
Durbin-Watson stat   1.951773    Prob(F-statistic)  0.000000
============================================================
Inverted AR Roots          .8      -.35
============================================================
The model with first and second-order autocorrelation looks good.
The Durban-Watson statistic is near 2. To be cautious, check for a
third-order effect.
============================================================
LS // Dependent Variable is YYYY
Date: 04/18/98   Time: 15:02
Sample(adjusted): 4 500
Included observations: 497 after adjusting endpoints
Convergence achieved after 5 iterations
============================================================
      Variable      CoefficienStd. Errort-Statistic  Prob.
============================================================
         C           2.060181   0.279652   7.366943   0.0000
         X           2.007865   0.037373   53.72512   0.0000
       AR(1)         0.553574   0.045326   12.21324   0.0000
       AR(2)         0.337364   0.049643   6.795838   0.0000
       AR(3)        -0.054397   0.045379  -1.198729   0.2312
============================================================
R-squared            0.861482    Mean dependent var 2.180052
Adjusted R-squared   0.860356    S.D. dependent var 2.723471
S.E. of regression   1.017734    Akaike info criter 0.045167
Sum squared resid    509.6051    Schwarz criterion  0.087507
Log likelihood      -711.4364    F-statistic        764.9705
Durbin-Watson stat   1.981769    Prob(F-statistic)  0.000000
============================================================
Inverted AR Roots          .8       .14       -.45
============================================================