Note Set 5 Handouts
============================================================ LS // Dependent Variable is GNP Date: 04/04/98 Time: 21:54 Sample: 1915 1988 Included observations: 74 ============================================================ Variable CoefficienStd. Errort-Statistic Prob. ============================================================ C 3.025348 0.547696 5.523772 0.0000 MILMOB 3.697863 0.547363 6.755782 0.0000 ============================================================ R-squared 0.387966 Mean dependent var 3.061841 Adjusted R-squared 0.379466 S.D. dependent var 5.980692 S.E. of regression 4.711230 Akaike info criter 3.126553 Sum squared resid 1598.089 Schwarz criterion 3.188825 Log likelihood -218.6839 F-statistic 45.64060 Durbin-Watson stat 1.266900 Prob(F-statistic) 0.000000 ============================================================To test whether or not the period 1915-1945 has the same linear specification as the period 1946-1988, we perform the Chow Breakpoint Test.
============================================================ Chow Breakpoint Test: 1946 ============================================================ F-statistic 0.079328 Probability 0.923820 Log likelihood ratio 0.167533 Probability 0.919646 ============================================================So we do not reject the null hypothesis.
============================================================ LS // Dependent Variable is DCOUT Date: 04/04/98 Time: 22:01 Sample: 1 25 Included observations: 25 ============================================================ Variable CoefficienStd. Errort-Statistic Prob. ============================================================ C 0.130875 0.125989 1.038779 0.3097 WIND 0.241149 0.019049 12.65927 0.0000 ============================================================ R-squared 0.874493 Mean dependent var 1.609600 Adjusted R-squared 0.869036 S.D. dependent var 0.652278 S.E. of regression 0.236052 Akaike info criter-2.810787 Sum squared resid 1.281573 Schwarz criterion -2.713277 Log likelihood 1.661381 F-statistic 160.2571 Durbin-Watson stat 0.536610 Prob(F-statistic) 0.000000 ============================================================
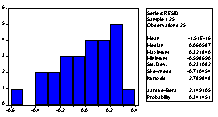
The p-value of the Jarque-Bera statistic is 0.341451. Hence, we
would not reject the null hypothesis that the residuals
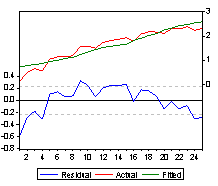
are normally distributed. However, it is clear from residual plot that
they are not normally distributed.
Indeed, doing a Chow breakpoint test here:
CHOW 12
============================================================ Chow Breakpoint Test: 12 ============================================================ F-statistic 24.48672 Probability 0.000003 Log likelihood ratio 30.08983 Probability 0.000000 ============================================================
So we would reject the null hypothesis that the first 11 observations
have the same linear structure as the last 14 observations.
The correct specification is:
LS DCOUT C 1/WIND
============================================================ LS // Dependent Variable is DCOUT Date: 04/04/98 Time: 22:13 Sample: 1 25 Included observations: 25 ============================================================ Variable CoefficienStd. Errort-Statistic Prob. ============================================================ C 2.978860 0.044902 66.34096 0.0000 1/WIND -6.934547 0.206434 -33.59215 0.0000 ============================================================ R-squared 0.980025 Mean dependent var 1.609600 Adjusted R-squared 0.979156 S.D. dependent var 0.652278 S.E. of regression 0.094171 Akaike info criter-4.648660 Sum squared resid 0.203970 Schwarz criterion -4.551150 Log likelihood 24.63479 F-statistic 1128.433 Durbin-Watson stat 2.269181 Prob(F-statistic) 0.000000 ============================================================
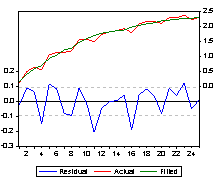
This looks a lot better. Now the Chow breakpoint test does not reject the null hypothesis that the first 11 observations have a different linear model from the last 14 observations.
============================================================ Chow Breakpoint Test: 12 ============================================================ F-statistic 1.053475 Probability 0.366442 Log likelihood ratio 2.390274 Probability 0.302662 ============================================================CIGGY.WF1
Examples.
Under View select Representation
Estimation Command: ===================== LS CARMON C TAR NICO WEIGHT Estimation Equation: ===================== CARMON = C(1) + C(2)*TAR + C(3)*NICO + C(4)*WEIGHT Substituted Coefficients: ===================== CARMON = 3.2021885 + 0.96257379*TAR - 2.6316601*NICO - 0.13048044*WEIGHT
Under View select Coefficient Test then select
Wald Test. Note that this is testing a null hypothesis
that the coefficients on nicotine and weight are both equal to zero.
We do not reject this
null hypothesis.
==================================================== Wald Test: Equation: Untitled ==================================================== Null HypothesisC(3)=0 C(4)=0 ==================================================== F-statistic 0.233600 Probability 0.793708 Chi-square 0.467199 Probability 0.791679 ====================================================