Predicting The Senate Vote
on John Roberts
Royce Carroll, Jeff Lewis, Keith Poole, and Howard Rosenthal
29 September 2005
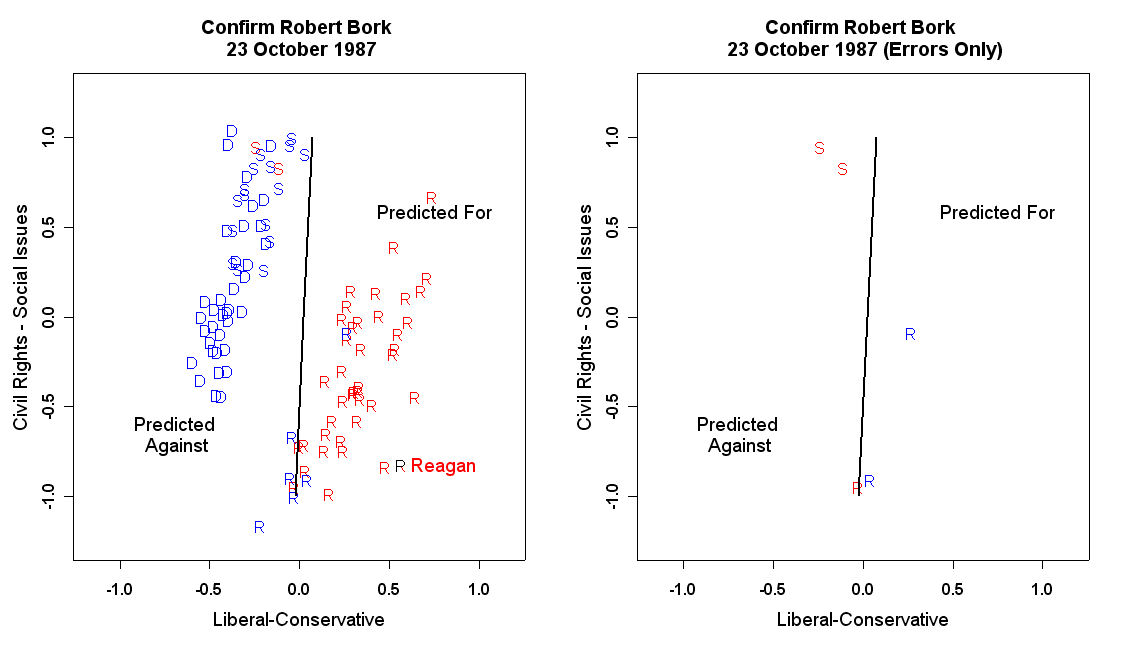
How members of the Senate responded to the Bork nomination can be
understood nearly entirely
as a matter of basic, long-run liberal-conservative orientations.
Using NOMINATE, a one dimensional scaling algorithm for binary choice
data
(Poole and Rosenthal, 1985) we scaled the senators based on their 1985
voting records. NOMINATE results have been available to other
researchers
for some time and form the basis for the analysis in Macdonald and
Rabinowitz (1987). The results match up perfectly with the outcome of the
Senate committee hearings. The committee vote, in conjunction with
the scaling, was used to predict that Judge Bork would fail to be
confirmed by a 59-41 vote. The actual vote was 58-42.
As the hearings opened, five senators, Kennedy, Eiden, Simon,
Leahy, and Metzenbaum, declared their opposition to Bork; four,
Byrd, Deconcini, Heflin, and Specter were undecided; and five,
Simpson, Hatch, Humphrey, Grassley, and Thurmond supported
the Reagan nominee. (See Table 1.) Table 1 shows that the
scaled values of the five "against" were all to the left of
the four undecided who were all to the left of the five Bork
supporters. The first undecided senator to declare himself
was Specter of Pennsylvania. Since Specter was to the right
of Byrd, Deconcini, and Heflin, one could predict that the
other three senators would also come out against Bork. They
did, and the final committee vote was 9-5 against.
Fourteen of the fifteen senators on the committee were
already serving in 1983. Our 1983 scaling shows, for these
14, exactly the same order as in
1985, demonstrating the great stability of the liberal-conservative
dimension. Consequently, all the information about the potential
voting alignments of the 14 most senior members was already
"known" as early as 1983. The 15th member, Simon of Illinois,
was generally known to be extremely liberal; he was a sure bet
to have opposed Bork.
In 1985, 51 senators were to the left of Specter and 41
to the right of Grassley. Consequently, 52 senators would
be predicted to vote No in a final confirmation vote and
42 would be predicted to vote favorably to Judge Bork.
If we split evenly the four senators (Heinz, Durenberger,
Cohen, and Stafford) between Specter and Grassley, we would
arrive at a 54-46 prediction. Interestingly, this could
suggest the 1986 elections were not crucial to Bork's
defeat. In other words, Specter was already to the right
of the median of the 99th Senate. Of course, the 1986
elections may have been important for a variety of reasons.
Specter and others, both inside and outside the Senate, may
have interpreted the elections as a signal that the mood of
the country had changed and that they would not find it
politically damaging to differ with the White House.
The committee chairmanship had changed hands. And, perhaps
most importantly, the 1986 elections drove home the importance
of black constituents to Southern Democrats.
What might have happened in the 99th Senate is speculation.
What would actually happen when the 100th Senate came to a
vote? Making a prediction is complicated by the fact that 14
new senators entered the freshman class of 1987. Two Democrats
on Specter's left were replaced by Republicans. We predicted
that these entrants would vote for confirmation. Two Democrats
and one Republican on his left were replaced by Democrats; for
these three senators, we predict an against vote. To Grassley's
right, seven Democrats replaced Republicans. All these new
Democrats were predicted to vote against confirmation. John
McCain, a Republican who replaced Barry Goldwater, was predicted
to vote for. The net effect of all the replacements is a gain of
five votes against Bork's appointment. As a result, our prediction,
based on the committee vote, was 59-41 against confirmation.
The actual vote was 58-42. Off by one vote in the aggregate, we
misclassified seven individual senators. Most of the errors were
offsetting. Favorable votes by Boren, Hollings, and Hatfield, all
to Specter's left, were offset by negative votes from Chafee,
Packwood, and Warner, all to Grassley's right. The group between
Specter and Grassley split 3-1 rather than 2-2. Ex post
classification errors are minimized by a "cutting line" between
Specter and Heinz. In addition to the six offsetting errors,
the cutting line prediction also results in Stafford being
counted as an error.
True, predicting a strict party line vote would have done just
as well. The party prediction would generate two more errors,
Specter and Weicker, while correcting the error on Hatfield.
So, in this case, a party model would make only one more error
than a liberal-conservative model. But this comparison misses
the interesting information in the liberal-conservative model.
The liberal-conservative model implies that the errors will
occur near the cutting line (Poole and Rosenthal, 1985).
Disregarding replacements, we find that no errors occur among
the 38 senators to the left of Boren nor among the 25 senators
to the right of Warner. The seven "errors" are concentrated
among the 23 senators in the middle of the spectrum.
The critical role of the middle is also shown in the
sequence in which the senators announced their votes. On
October 8, the New York Times reported that a large number
of senators had made commitments the previous day. These
were all either returnees from the 99th Congress concentrated
near the middle of the dimension (Sasser, Chiles, Dixon, Exon,
and Hatfield) or newly elected senators (Breaux, Conrad, Graham,
Fowler, and Shelby) who could be expected to be cue takers rather
than cue givers. On October 9, the Times published an exhaustive
list of voting intentions as of the previous day. This establishes
that, after October 7, only Proxmire, Stennis, Nunn, Heinz,
D'Amato, Evans, and Warner were uncommitted among returnees.
These late declarers were highly concentrated near the middle
of the dimension. While reporting of commitments made prior
to October 7 was less systematic, those senators who committed
in October appear to be concentrated in the middle (See Table
1 for further details). Strong liberals and strong conservatives
appear to have generally made their positions known in September
or earlier.
As a further check on the consistency of liberal-conservative
positions as they apply to judicial confirmations, consider the
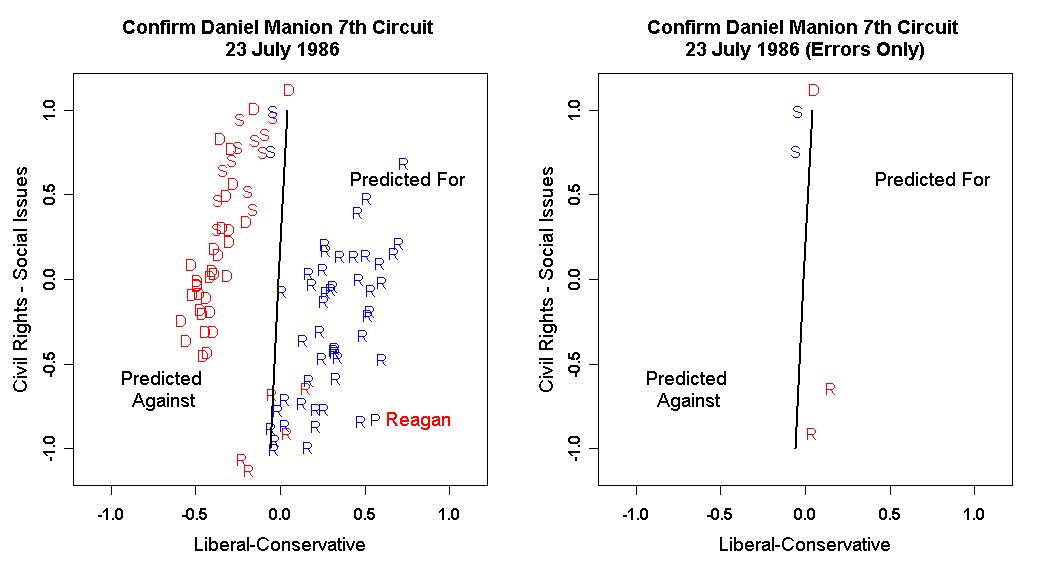
Manion and Rehnquist votes in 1986. Confirmation of Daniel
Manion as an Appeals Court judge was decided by Vice President
Bush breaking a tie to confirm. The optimal cutting line on this
vote is between Hollings and Heflin. There are only four
classification errors (Zorinsky, Specter, Evans, and Kassebaum).
A party model would have corrected the Zorinsky error but made
errors on Long, Heflin, Weicker and Mathias. Again, the
liberal-conservative model has errors that are contained in
the middle of the spectrum.
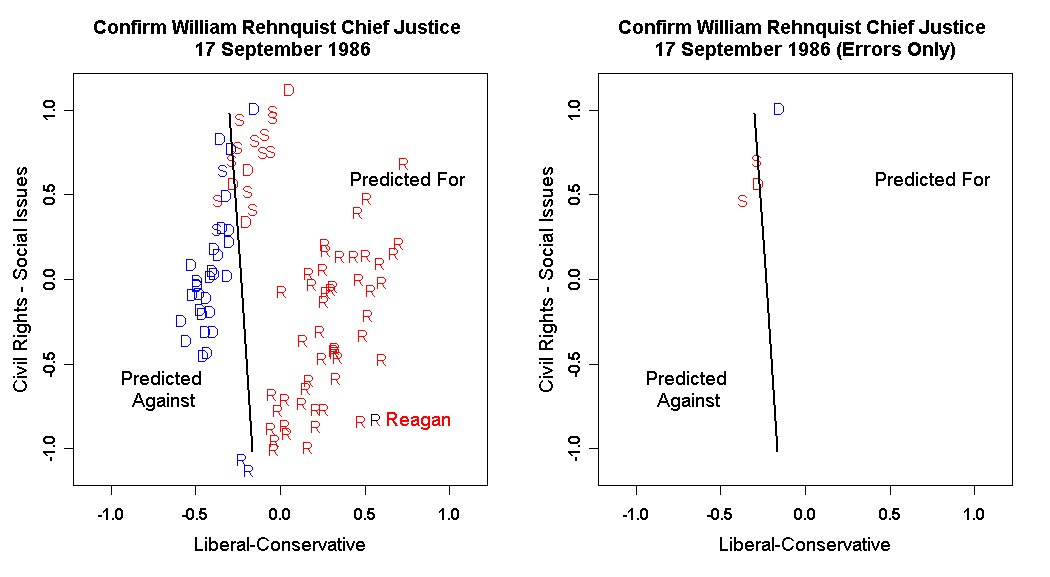
A similar story applies to Rehnquist. Here, since the vote
was not close, the errors are not in the middle of the spectrum
but near the cutting line, as expected. The errors are Pell,
Leahy, Bumpers, Johnston, and Exon. The cutting line is between
Glenn and Ford. In this case, the party model does poorly.
While the party model "corrects" the Johnston and boon errors,
it makes additional errors an Ford, Bingaman, Chiles, Dixon,
DeConcini, Bentsen, Proxmire, Stennis, Nunn, Hollings, Zorinsky,
and Long.
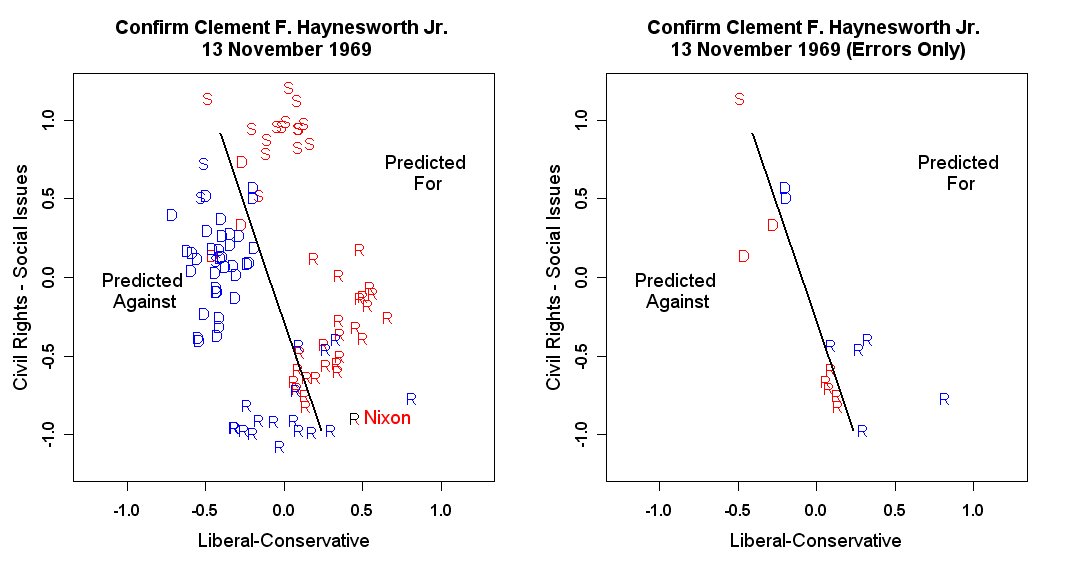
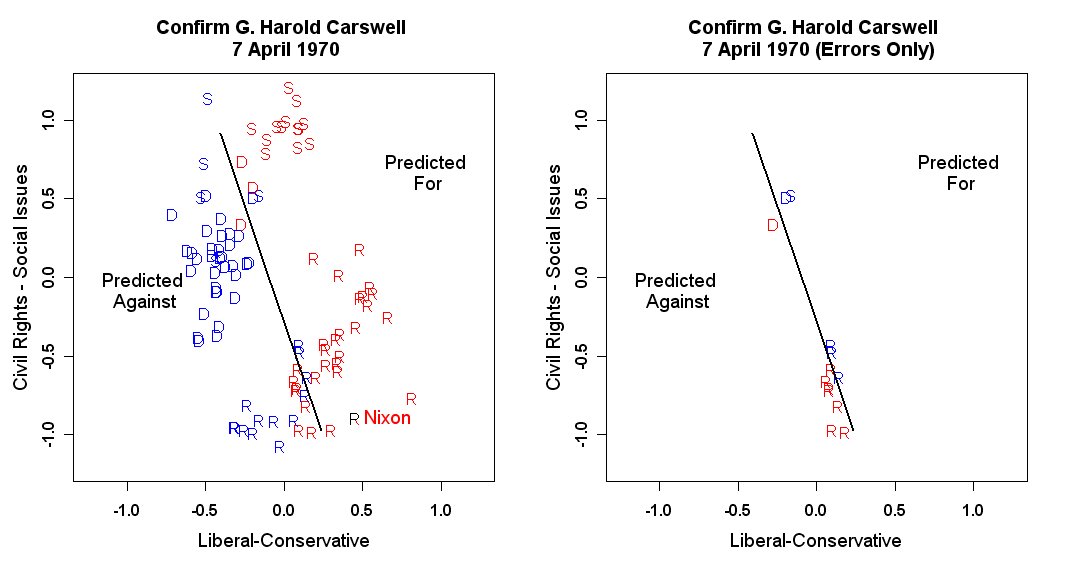
The last highly contested confirmation votes prior to the
Reagan era involved the nominations of Haynesworth and Carswell
to the Supreme Court by President Nixon. There were only 17
senators who served in 1985 who were also serving in this earlier
period. Even if we look backwards and do not allow for changes in
position over a 16 year period, we are still able to classify
correctly 14 of the 17 senators. One of the errors, Byrd of West
Virginia, clearly represents a rare case of spatial movement,
a move likely connected to becoming majority leader. Again the
errors are in the middle. indeed, the two remaining errors,
Hatfield and Packwood, both of Oregon, were also errors on
the Bork vote.
What our analysis shows is that voting on judicial confirmations
follows a persistent, temporally stable, ideological pattern.
Contrary to conservative claims that the Bork case represented a
fundamental change in the process, ideological voting is dej� vu.
Once a nomination becomes controversial, the pattern of voting
alignments will obey liberal-conservative consistency. What is
not foreordained is the process that makes a nomination
controversial. A year prior to Bork, a perhaps equally conservative
jurist, Antonin Scalia, was confirmed 98-0. Similarly, while the
Rehnquist nomination was debated, the cutting line fell far to the
left of the Bork line. Those who face the practical concern of
insuring a nominee's approval are probably wasting energy on
rhetoric that argues that a nominee's political views should
not influence the vote. Their attention would be better focused
on getting a favorable location of the cutting line. Where the
cutting line falls, as the Scalia-Bork contrast suggests,
reflects the framing and timing of a nomination
as well as more substantive concerns.
Table 1.   Liberal-Conservative Positions and Confirmation Votes 1986-87
                         ----- Bork -----
                       Committee     Senate
          1985 Pos.  Early   Final  Final
                     Stance  Vote   Vote  Manion Rehnquist
SARBANES     -0.917                 A <7     A     A
HART, G      -0.907                (A <7)    A     A     Repl. by Wirth, Pred. Against
SIMON, P     -0.812     A     A     A <7     A     A
INOUYE       -0.806                 A <7     A     A
METZENBAUM   -0.795     A     A     A <7     A     A
MELCHER      -0.789                 A <7     A     A
HARKIN, T    -0.789                 A <7     A     A
MATSUNAGA    -0.789                 A <7     A     A
KENNEDY, E.  -0.764     A     A     A <7     A     A
BURDICK      -0.748                 A <7     A     A
LEVIN, C     -0.737                 A <7     A     A
RIEGLE       -0.732                 A <7     A     A
KERRY, J     -0.729                 A <7     A     A
CRANSTON     -0.727                 A <7     A     A
PELL         -0.703                 A <7     A     P
EAGLETON     -0.700                (P <7)    A     A     Replaced by Bond, Pred. For
LAUTENBERG   -0.693                 A <7     A     A
MOYNIHAN     -0.636                 A <7     A     A
MITCHELL, G  -0.619                 A <7     A     A
DODD, C JR   -0.613                 A <7     A     A
BAUCUS, M    -0.610                 A <7     A     A
ROCKEFELLER  -0.608                 A <7     A     A
LEAHY        -0.596     A     A     A <7     A     P
BIDEN J      -0.592     A     A     A <7     A     A
GORE, A      -0.590                 A <7     A     A
SASSER       -0.579                 A =7     A     A
PRYOR, D     -0.572                 A <7     A     A
BUMPERS      -0.545                 A <7     A     P
BYRD         -0.527     U     A     A <7     A     A
BRADLEY, W   -0.526                 A <7     A     A
GLENN        -0.520                 A <7     A     A
----------------------------------------------------------- Optimal Cut Line Rehnquist
FORD         -0.473                 A <7     A     P
BINGAMAN     -0.471                 A <7     A     P
CHILES L     -0.440                 A =7     A     P
JOHNSTON J   -0.403                 A =1     A     A
DIXON, A     -0.383                 A =7     A     P
EXON, J      -0.380                 A =7     A     A
DECONCINI    -0.365     U     A     A <7     A     P
MATHIAS      -0.346                (A <7)    A     P     Repl. by Mikluski, pred. Ag.
BENTSEN L    -0.323                 A =1     A     P
BOREN, D     -0.309                 P <7     A     P
WEICKER L    -0.307                 A =6     A     P
PROXMIRE     -0.304                 A >7     A     P
STENNIS      -0.284                 A >7     A     P
NUNN S       -0.278                 A >7     A     P
HOLLINGS     -0.263                 P <7     A     P
----------------------------------------------------------- Optimal Cut Line Manion
HEFLIN, H    -0.238     U     A     A <7     P     P
HATFIELD     -0.178                 P =7     P     P
ZORINSKY     -0.175                (P <7)    A     P     Repl. by Karnes, pred. For.
LONG, R.     -0.161                (A =7)    P     P     Repl. by Breaux, pred. Ag.
ANDREWS, M   -0.141                (A =7)    P     P     Repl. by Conrad, pred. Ag.
SPECTER, A   -0.140     U     A     A =1     A     P
--------------------------------------------------------------- Ex Post Opt. Cut Line on Bork
HEINZ        -0.075                 P >7     P     P     After the committee vote,
DURENBERGER  -0.051                 P <7     P     P     these four senators were
COHEN, W     -0.048                 P <7     P     P     predicted to split 2-2,
STAFFORD R   -0.033                 A =6     P     P     but in fact split 3-1.
GRASSLEY, C  -0.032     P     P     P >7     P     P
CHAFEE       -0.024                 A =5     P     P
DAMATO, A     0.015                 P >7     P     P
PACKWOOD      0.028                 A =4     P     P
KASTEN, R     0.032                 P <7     P     P
DANFORTH      0.103                 P <7     P     P
PRESSLER, L   0.104                 P <7     P     P
STEVENS       0.139                 P <7     P     P
EVANS, D      0.158                 P <7     A     P
KASSEBAUM     0.164                 P <7     A     P
HAWKINS, P    0.164                (A =7)    P     P     Repl. by Graham, pred. Ag.
ABDNOR, J     0.167                (A <7)    P     P     Repl. by Daschle, pred. Ag.
GORTON, S     0.200                (A <7)    P     P     Repl. by Adams, pred, Ag.
WARNER, J     0.241                 A >7     P     P
COCHRAN, T    0.270                 P <7     P     P
RUDMAN, W     0.299                 P <7     P     P
MURKOWSKI     0.304                 P <7     P     P
NICKLES, D    0.315                 P <7     P     P
TRIBLE, P     0.321                 P <7     P     P
MCCONNELL     0.329                 P <7     P     P
DOSCHWITZ     0.333                 P <7     P     P
ROTH W        0.352                 P <7     P     P
MATTINGLY     0.396                (A =7)    P     P     Repl. by Fowler, Pred. Ag.
LUGAR         0.403                 P <7     P     P
WILSON        0.408                 P <7     P     P
DOLE          0.425                 P <7     P     P
DOMENICI P    0.434                 P <7     P     P
QUAYLE, J D   0.481     P     P     P <7     P     P
SIMPSON, A    0.482     P     P     P <7     P     P
HATCH         0.556     P     P     P <7     P     P
THURMOND      0.585                 P <7     P     P
DENTON, J     0.597                (A =7)    P     P     Repl. by Shelby, Pred. Ag.
LAXALT        0.670                (A >7)    P     P     Repl. by Reid, Pred. Ag.
GARN          0.673                 P <7     P     P
GOLDWATER     0.691                 P <7     P     P     Repl. by McCain, Pred. For.
ARMSTRONG     0.706                 P <7     P     P
HUMPHREY, G   0.806     P     P     P <7     P     P
GRAMM, P      0.807                 P <7     P     P
HECHT         0.808                 P <7     P     P
MCCLURE J     0.965                 P <7     P     P
EAST, J       0.974                (A =2)    P     P     Repl. by Sanford, Pred. Ag.
HELMS J       1.000                 P <7     P     P
WALLOP        1.000                 P <7     P     P
SYMMS, S      1.000                 P <7     P     P


Legend to Preceding Table:
A=anti-confirmation
P=pro-confirmation
U=undecided
Vote of replacements shown in parentheses
>7 = Bork vote announced after 10/7
=y =  Bork vote announced on 10/7
<7 = Bork vote announced before 10/7
Classification errors shown in boldface italics.
Sources: Bork; New York Times, Washington Post; Manion,
Rehnquist; Congressional Quarterly
Table 2. 1969-70 Confirmation Votes
           1985 Position  Haynesworth  Carswell
INOUYE          -0.806         A         A
KENNEDY,E.      -0.764         A         A
CRANSTON        -0.727         A         A
PELL            -0.703         A         A
EAGLETON        -0.700         A         A
BYRD            -0.527         P         P
MATHIAS         -0.346         A         A
PROXMIRE        -0.304         A         A
------------------------------------------ Optimal Cutting Line
STENNIS         -0.284         P         P
HOLLINGS        -0.263         P         P
HATFIELD        -0.178         A         A
LONG, R.        -0.161         P         P
PACKWOOD         0.028         A         A
STEVENS          0.139         P         P
DOLE             0.425         P         P
THURMOND         0.585         P         P
GOLDWATER        0.691         P         P


Legend: A-Anti-confirmation; P-Pro-confirmation;
Classification errors shown in boldface italics
Source: Congressional Quarterly