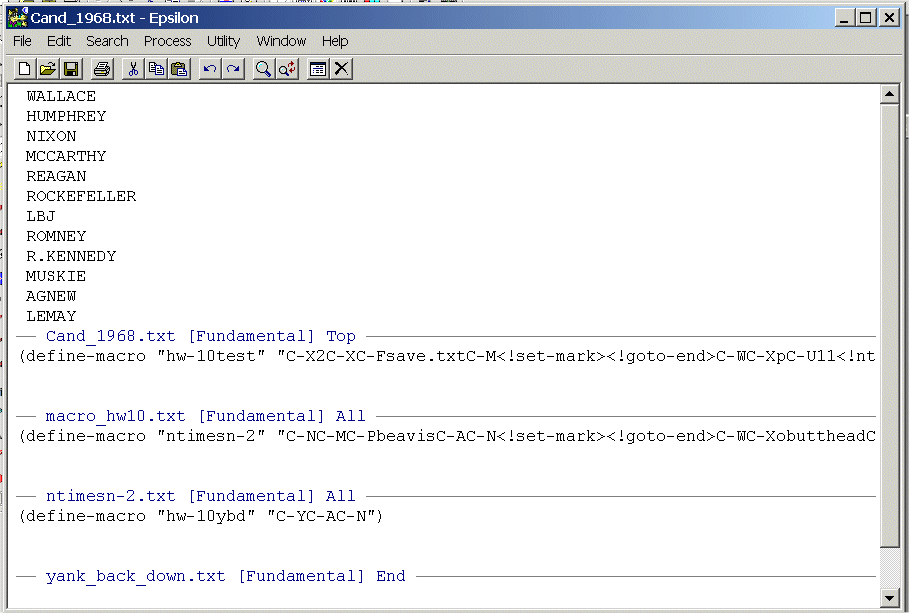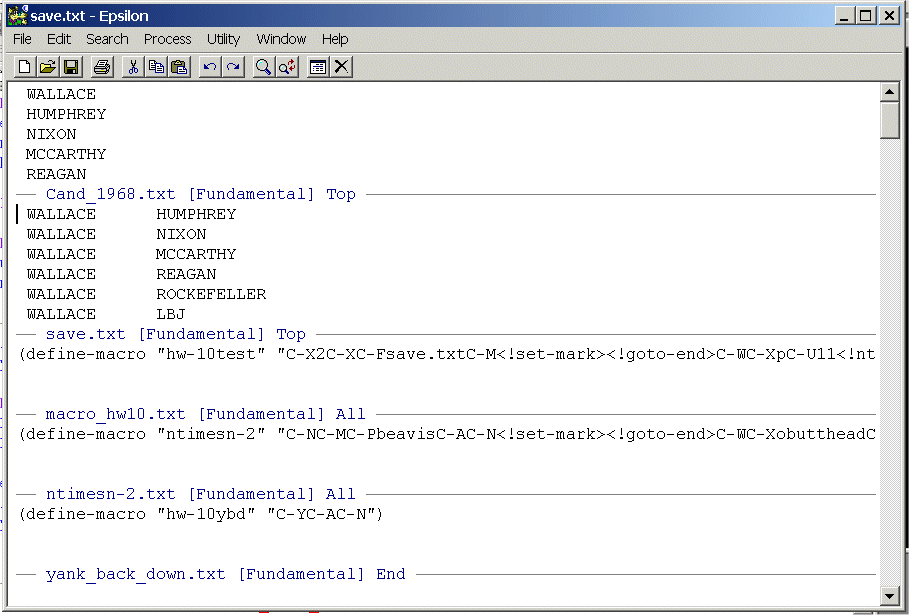
With the cursor in the top window at the beginning of the file (the WALLACE line), type, in turn:
ALT-Xload-buffer
ALT-Xload-buffer
ALT-Xload-buffer
Now type:
ALT-Xhw-10test

-
Trace your way through these macros and modify them to work with the fourteen 2000
candidates/parties. Use the file below with the altered macro:
OPTIONAL FOR EXTRA CREDIT (up to 50 POINTS)Write your own Epsilon command line macro that produces the unique pairs of names and turn it in along with instructions on how to use it. The number of extra credit points will be determined by how elegant your solution is!
            Respondent
               1   2      "Roll Call 1-2"
 WALLACE      50  60            6
 HUMPHREY     97  97            0
 NIXON        85  65            1
 MCCARTHY     60  70            6
 REAGAN       40  30            1
 ROCKEFELLER  40  40            0
 LBJ          75  97            6
 ROMNEY       30  50            6
 R.KENNEDY    80  97            6
 MUSKIE       60  97            6
 AGNEW        40  50            6
 LEMAY        30  60            6
Continuing this process for all unique pairs of respondents produces a
"roll call" matrix of 12 by 890,445 for the 1968 Thermometer data. For 2000,
the "roll call" matrix is 14 by 1,069,453. This
process is discussed in more detail in the assigned reading
Non-Parametric Analysis of Binary Choice Data. Note
that, ignoring the abstentions -- the "0"s -- there are only 212 or
4,096
unique patterns of "roll calls" for the 1968 Thermometer data. For
2000, there are only 214 or 16,384
unique patterns of "roll calls."We are going to analyze a subset -- 21,000 roll calls -- of these "roll call" matrices with a large version of the Optimal Classification (OC) program. Download the program, "control card" files, and two data files below:
-
Run PERFLBIG on the 1968 data. Your
PERF21.DAT file should look something like this:
 29 MARCH     2003  15.26.47.00.
 RANDOM NUMBER SEED     76200
\OLDTIME\VOTE_THERM_1968_RESP.ORD
NON-PARAMETRIC MULTIDIMENSIONAL UNFOLDING OF THERMOMETER DATA
    221000   10   36    2
(36A1,100(3900I1))
(I5,1X,36A1,2I5,50F8.3)
 ******************************************************************************
  1 ROLL CALLS   2   16742  188987  0.08859  0.91141  0.73734           0.00000
    LEGISLATORS  2   16855  188987  0.08919  0.91081  0.73557  0.00000
  2 ROLL CALLS   2   16712  188987  0.08843  0.91157  0.73781           0.99719
    LEGISLATORS  2   16716  188987  0.08845  0.91155  0.73775  1.00000
  3 ROLL CALLS   2   16694  188987  0.08833  0.91167  0.73809           0.99775
    LEGISLATORS  2   16701  188987  0.08837  0.91163  0.73798  1.00000
  4 ROLL CALLS   2   16687  188987  0.08830  0.91170  0.73820           0.99833
    LEGISLATORS  2   16696  188987  0.08834  0.91166  0.73806  1.00000
  5 ROLL CALLS   2   16686  188987  0.08829  0.91171  0.73822           0.99844
    LEGISLATORS  2   16697  188987  0.08835  0.91165  0.73805  1.00000
  6 ROLL CALLS   2   16683  188987  0.08828  0.91172  0.73826           0.99859
    LEGISLATORS  2   16690  188987  0.08831  0.91169  0.73816  1.00000
  7 ROLL CALLS   2   16683  188987  0.08828  0.91172  0.73826           0.99876
    LEGISLATORS  2   16686  188987  0.08829  0.91171  0.73822  1.00000
  8 ROLL CALLS   2   16682  188987  0.08827  0.91173  0.73828           0.99830
    LEGISLATORS  2   16688  188987  0.08830  0.91170  0.73819  1.00000
  9 ROLL CALLS   2   16682  188987  0.08827  0.91173  0.73828           0.99846
    LEGISLATORS  2   16682  188987  0.08827  0.91173  0.73828  1.00000
 10 ROLL CALLS   2   16132  188987  0.08536  0.91464  0.74691           0.99795
    LEGISLATORS  2   16136  188987  0.08538  0.91462  0.74685  1.00000
 MEAN VOLUME LEG.   0.0020   0.0000   1.0000   0.0000   0.0000
 MACHINE PREC.   2   16133  188987   0.08537   0.91463
                      15.26.47.03.
 ELAPSED TIME OF JOB  15.34.16.51.
Turn in your PERF21.DAT file.The first 20 lines or so of the coordinate output file PERF25.DAT should look something like this:
 29 MARCH     2003  15.26.47.00.
    1  WALLACE                             102917027   0.940   0.002   0.674  -0.297
    2  HUMPHREY                             99817534   0.943   0.002  -0.607   0.398
    3  NIXON                               193117642   0.891   0.002   0.389   0.263
    4  MCCARTHY                            128315966   0.920   0.002  -0.162  -0.936
    5  REAGAN                              199215712   0.873   0.002   0.392   0.122
    6  ROCKEFELLER                         106715510   0.931   0.002  -0.281  -0.959
    7  LBJ                                  80617529   0.954   0.002  -0.459   0.617
    8  ROMNEY                              115611186   0.897   0.002  -0.046   0.483
    9  R.KENNEDY                           214017710   0.879   0.002  -0.503   0.066
   10  MUSKIE                              137014832   0.908   0.002  -0.620  -0.073
   11  AGNEW                               131313696   0.904   0.002   0.514   0.311
   12  LEMAY                               105114643   0.928   0.002   0.708   0.005
    1    1   3   7   1  10   2  0.667  0.438  0.605  0.797
    2    2   4   5   2   8   4  0.500  0.089 -0.266 -0.964
    3    3   8   4   1   9   3  0.750  0.401  0.346  0.938
    4    4   3   8   3   1  11  0.000 -0.591  0.993  0.115
    5    5   5   7   2   3   9  0.600 -0.177  0.175  0.985
    6    6   3   9   0   3   9  1.000 -0.270  0.475  0.880
    7    7   4   8   0   8   4  1.000  0.292  0.884 -0.467
                      etc etc etc
Use R to plot the 12 candidates in two dimensions.
This plot should be very similar to the one
you did for question 2 of homework 5
and question 3 of homework 7.Place hypothetical voters at Wallace's position, Humphrey's position, and Nixon's Position -- let them be voters 1, 2, and 3 respectively. Fill in the "roll call" matrix below that is implied by their positions.
               "Roll Call 1-2"  "Roll Call 1-3"  "Roll Call 2-3"
 WALLACE              ?                ?                ?
 HUMPHREY             ?                ?                ?
 NIXON                ?                ?                ?
 MCCARTHY             ?                ?                ?
 REAGAN               ?                ?                ?
 ROCKEFELLER          ?                ?                ?
 LBJ                  ?                ?                ?
 ROMNEY               ?                ?                ?
 R.KENNEDY            ?                ?                ?
 MUSKIE               ?                ?                ?
 AGNEW                ?                ?                ?
 LEMAY                ?                ?                ?
Although there are 212 or 4,096 possible voting patterns for
the 1968 candidate configuration,
not all of these are consistent with the configuration in two dimensions!
Give an example of a pattern that is impossible given the 1968
configuration in two dimensions.Run PERFLBIG on the 2000 data. Turn in a copy of your PERF21.DAT file.
Use R to plot the 14 candidates/parties in two dimensions. This plot should be very similar to the one you did for question 2 of homework 8.
Place hypothetical voters at Bush's position, Gore's position, and Nader's Position -- let them be voters 1, 2, and 3 respectively. Fill in the "roll call" matrix below that is implied by their positions.
               "Roll Call 1-2"  "Roll Call 1-3"  "Roll Call 2-3"
 CLINTON              ?                ?                ?
 GORE                 ?                ?                ?
 BUSH                 ?                ?                ?
 BUCHANAN             ?                ?                ?
 NADER                ?                ?                ?
 MCCAIN               ?                ?                ?
 BRADLEY              ?                ?                ?
 LIEBERMAN            ?                ?                ?
 CHENEY               ?                ?                ?
 HILLARY              ?                ?                ?
 DEMPARTY             ?                ?                ?
 REPUBPARTY           ?                ?                ?
 REFORMPTY            ?                ?                ?
 PARTIES              ?                ?                ?
Although there are 214 or 16,384 possible voting patterns for
the 2000 candidate configuration,
not all of these are consistent with the configuration in two dimensions!
Give an example of a pattern that is impossible given the 2000
configuration in two dimensions.Download the program, control card file, and the 107th roll call data and place them in the same directory.
-
Use R to make a smoothed histogram
of the Republicans and Democrats in the 107th House using the estimated
coordinates above. Be sure to label everything appropriately. The plot
should look a lot like the one you did for question 3.a
of Homework 8.
Use R to make a smoothed histogram of 33 Nay and Present voters on the Iraqi resolution. Some of these 33 may not have served in the 107th but most of them did. Be sure to label everything appropriately.
Use Epsilon to change the number of dimensions to "2" in QUADSTRT.DAT and run the program again (be sure to save QUAD0048.DAT from the one dimensional run as it will be overwritten). Use R to plot the legislators in two dimensions. Use "D" for Non-Southern Democrats, "S" for Southern Democrats, "R" for Republicans, and "P" for President Bush. This graph should be in the same format as the one you did for question 3.b of Homework 8. Turn in the R code and the plot. Be sure to label everything appropriately.