C-X -- This means "Hold the Control key down and type X"
You should see the following:
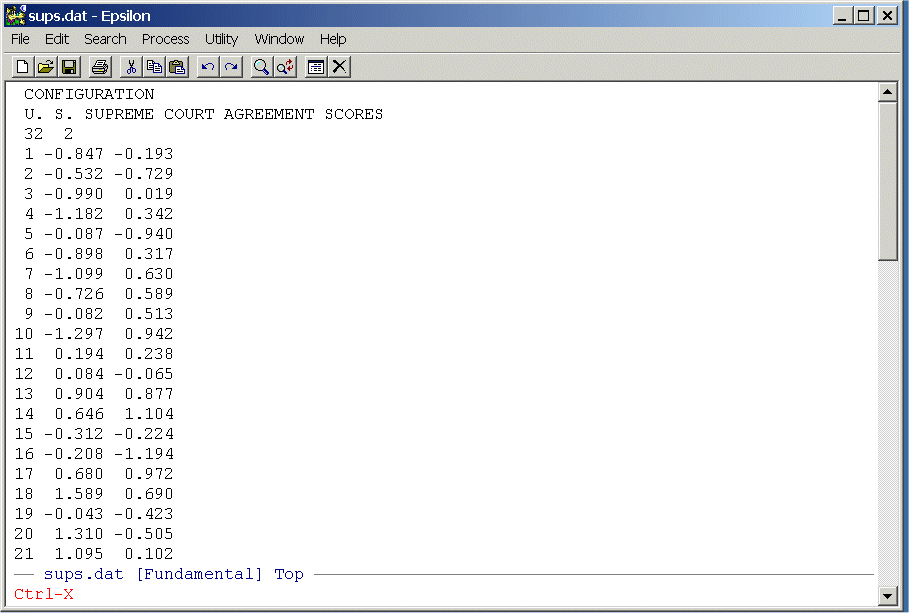
Now, simply hit the "2" key (that is, once you see Ctrl-X at the bottom of the Epsilon screen release those keys and just hit the "2" key). This produces a split screen that should look like this:
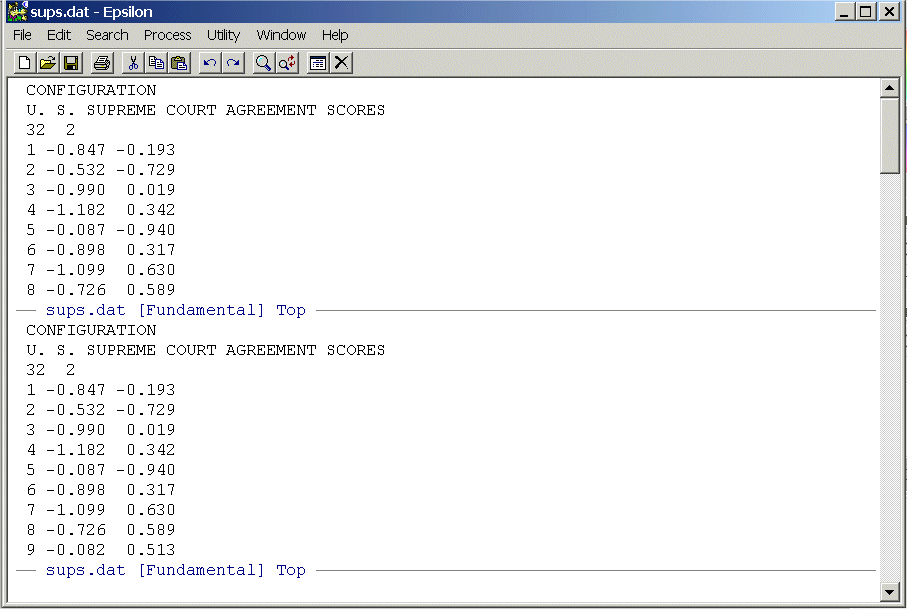
Note that your cursor will be in the bottom screen. Now we want to place SUPKYST.DAT in the bottom screen. To do this, use the command:
C-X C-F -- This means "Hold the Control key down and type X then hold the Control key down and type F"
You will see:
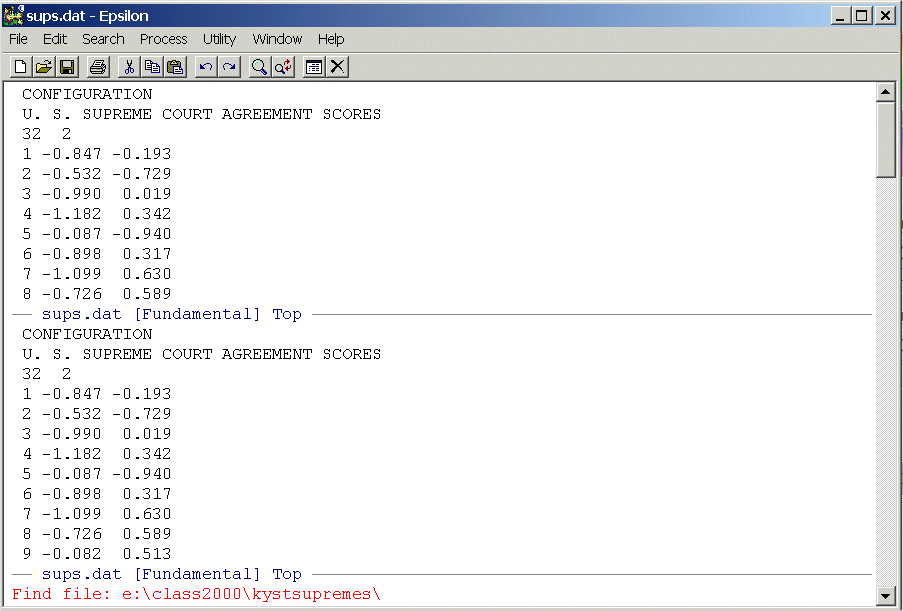
This is the "Find file" command and Epsilon will default to whatever directory that you are currently using. Your cursor will be at the end of path statement -- in my case e:\class2000\kystsupremes\ -- but you can type in any path statement you want. Since this is the directory that contains SUPKYST.DAT, we simply type that at the end of the path statement like this:
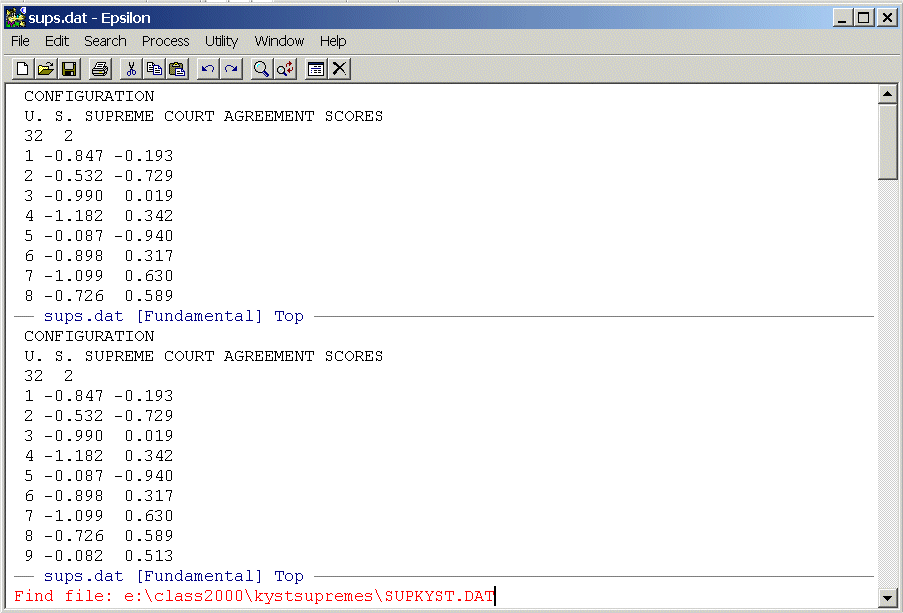
Now, just hit the Enter key and you should see:
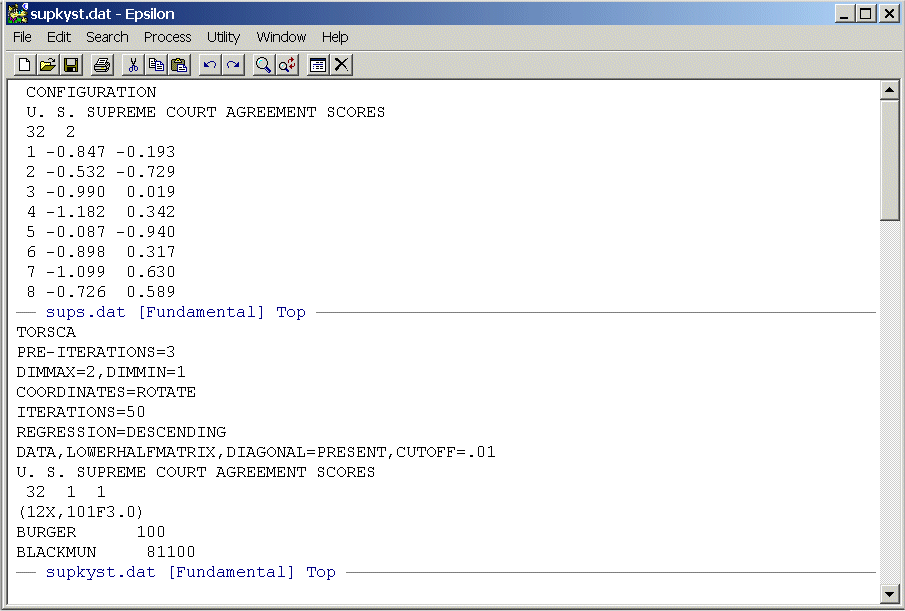
Before continuing with the problem, you will sometimes want to find a file but you have forgotten the name. Suppose, however, you know what directory it is in. In the above, instead of typing SUPKYST.DAT at the end of the path statement, try simply hitting the Enter key. You will see:
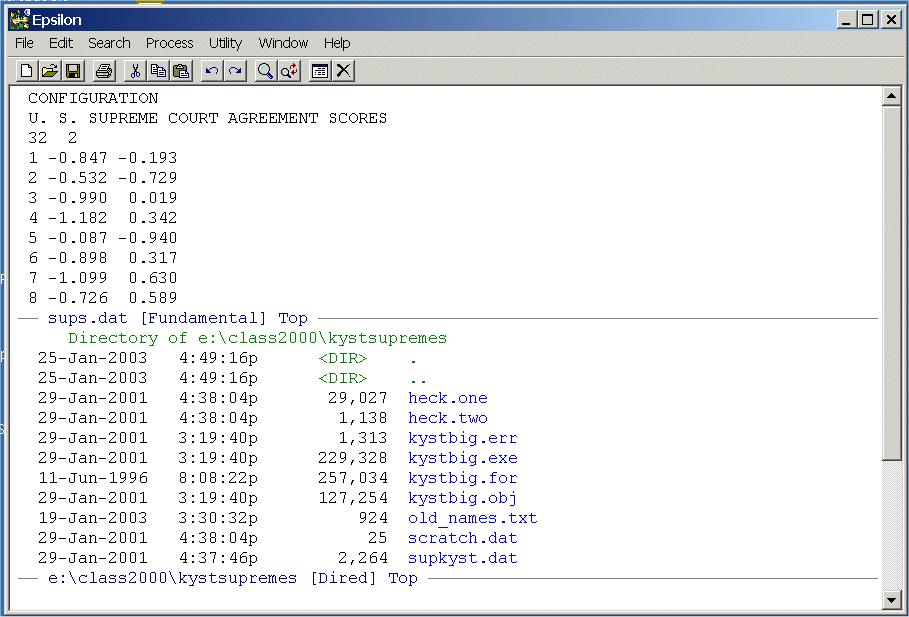
Epsilon lists all the files in the directory and the cursor will be positioned at the top. You can use the down and up arrow keys to move up and down the file list. Position the cursor at the beginning of the file you want and hit the Spacebar. The file will appear in the bottom window just as above. To close the screen your cursor is in you can use the command:
C-X 0 -- This means "Hold the Control key down and type X then type 0 (zero not ohh)"
To close all screens except the one your cursor is in, you can use the command:
C-X 1 -- This means "Hold the Control key down and type X then type 1"
What we are going to do next is write a macro that will take the names of the justices from the SUPKYST.DAT file and insert them into the coordinates embedded in SUPS.DAT. Since this will alter SUPS.DAT, we can use Epsilon to make a copy of the file that we can safely edit. To do this, you need to have the cursor in the upper screen. To toggle back and forth between screens use the command:
C-X o -- This means "Hold the Control key down and type X then type o (this is ohh, not zero!)"
This will move the cursor to the top screen. Now we are going to write a copy of SUPS.DAT to disk and we will call it SUPREME_NAMES.TXT. Type the command:
C-X C-W -- This means "Hold the Control key down and type X then hold the Control key down and type W"
You will see:
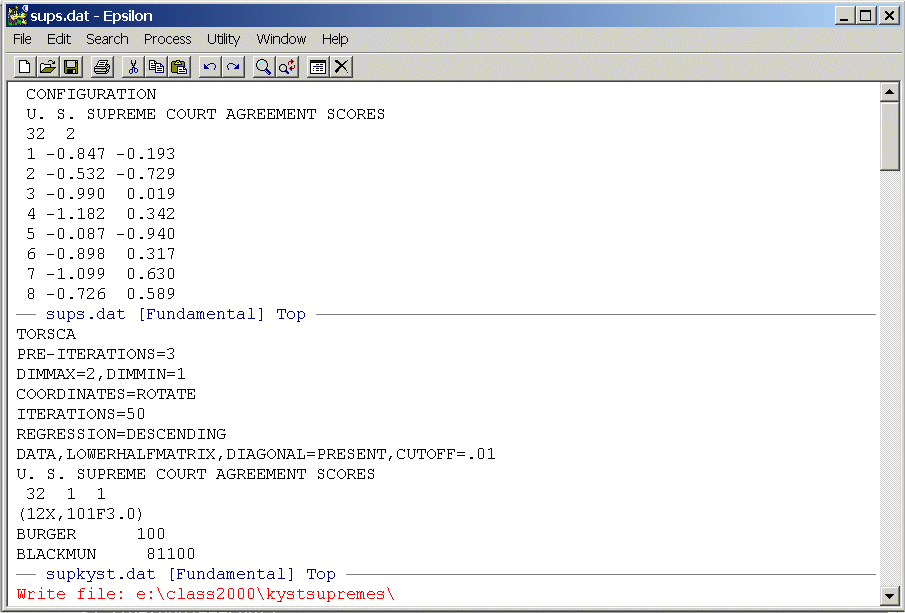
Note the Write File: at the bottom of the screen. This is exactly like the "Find file" command above. Type the name of the file you want to write to at the end of the path statement -- in our case -- SUPREME_NAMES.TXT -- and hit the Enter key. You should see this:
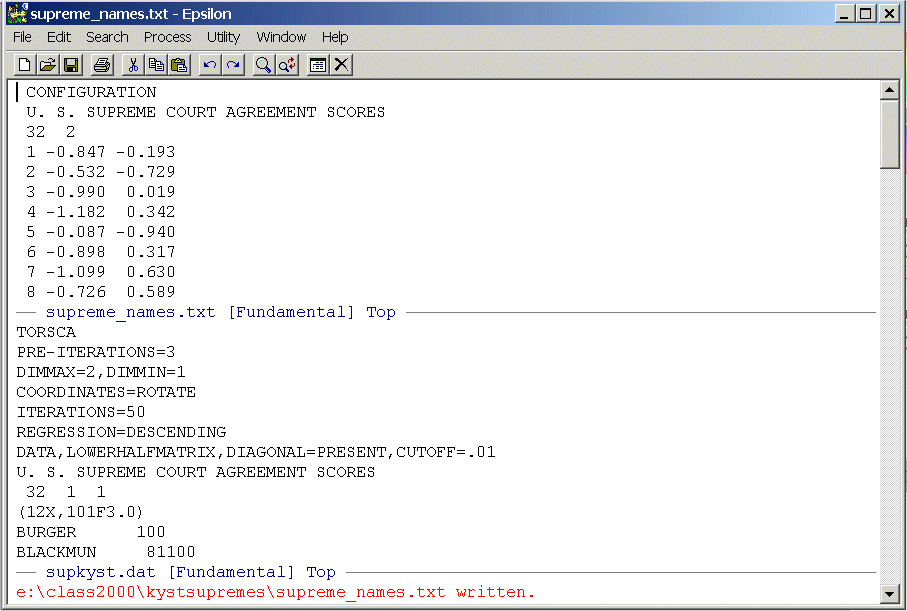
Note that the name of the file in the top screen has changed to supreme_names.txt. Now, delete everything in the file except the two dimensional coordinates. To do this, simply highlight the rows of the file (use the normal WINDOZE key combination of shift-down-arrow or shift-up-arrow) you want to delete and hit the Delete key. Position your cursor at the top of the screen to the far left. We are now going to write an Epsilon macro (to see a helpful example of a macro go through Advanced Multivariate Homework 3 from 2001). Before we begin, use the C-X o command to go down into the lower screen and position the cursor so that it is in front of justice Burger's name. Return to the upper screen using the C-X o command. To begin the macro, type:
C-X ( -- This means "Control-X" then "("
You will see:
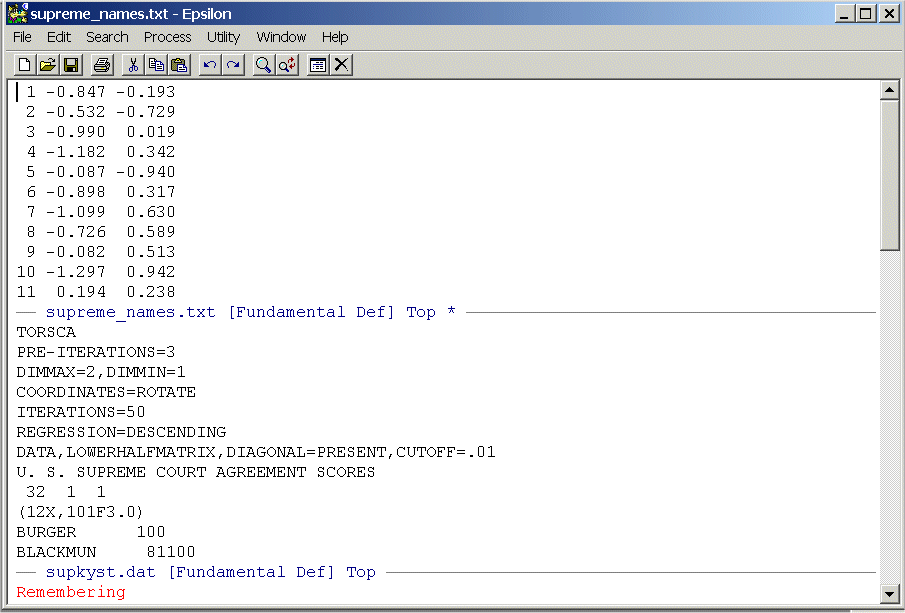
Note the Remembering at the bottom of the screen. Epsilon now records all the key-strokes that you enter until you give the command C-X ). (Also note the asterisk "*" to the far right of the name line at the bottom of the top screen. This is a signal from Epsilon that the file has been altered and not saved. If you clicked on "File Save" that asterisk will not be there.) We will not need the numbers 1 to 32 that are before the two dimensional coordinates. So enter the command:
C-D C-D -- This means "Control-D" twice. Note that this is exactly the same as hitting the Delete key twice.
You should see:
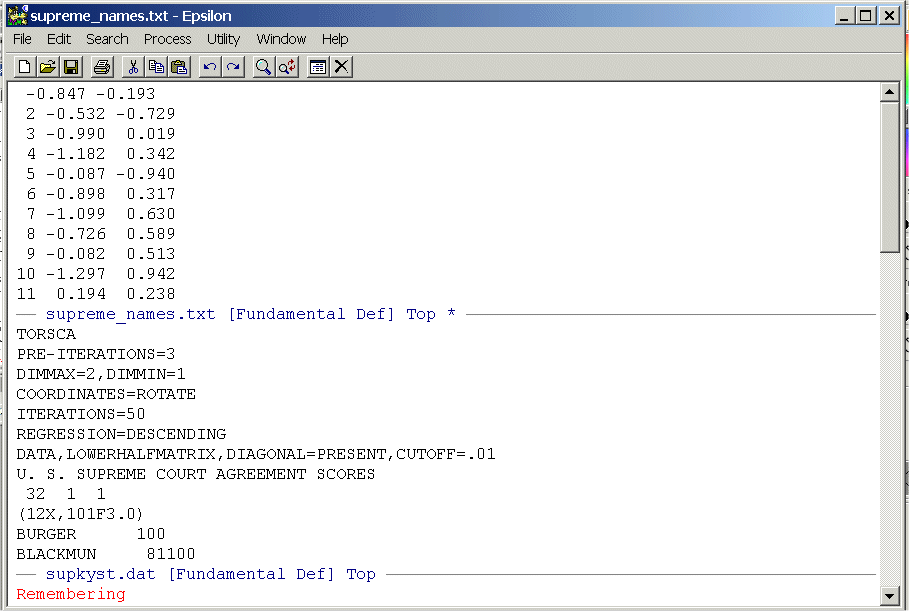
Now we are going down to the lower screen to pick up the names. To do this, first type:
C-X o to go to the lower screen, then type
C-F 12 times.
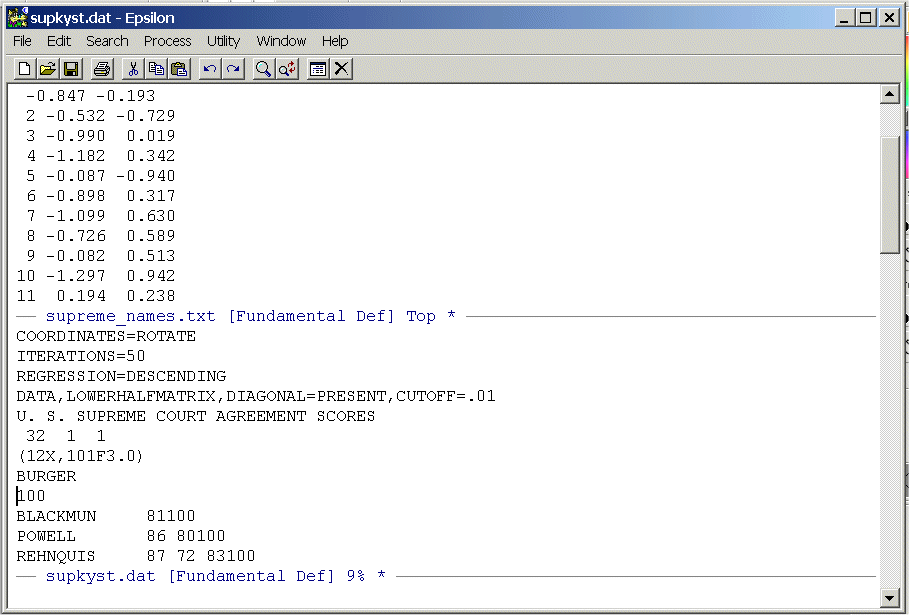
Your cursor will be right next to the "100" (C-F is the same as Right-Arrow.) Now type:
Enter
And you should see:
Now, enter the following commands one at a time:
C-P This moves the cursor up one line so it is once again in front of "Burger"
C-K Note that "Burger" disappears -- this places it in the "Kill Buffer"
C-Y Viola, it disgorges it -- this "Yanks" the text from the buffer (the cursor will be at the end)
C-D This re-assembles the original line.
C-A This takes the cursor to the beginning of the line
C-N This positions the cursor at the beginning of the line below. We need to do this so that when the macro runs the first time it gets Blackmun, not Burger!!
C-X o Go back up to the top screen
C-Y Yank Burger from the buffer
C-A Go to the beginning of the line
C-N Position the cursor at the beginning of the line below
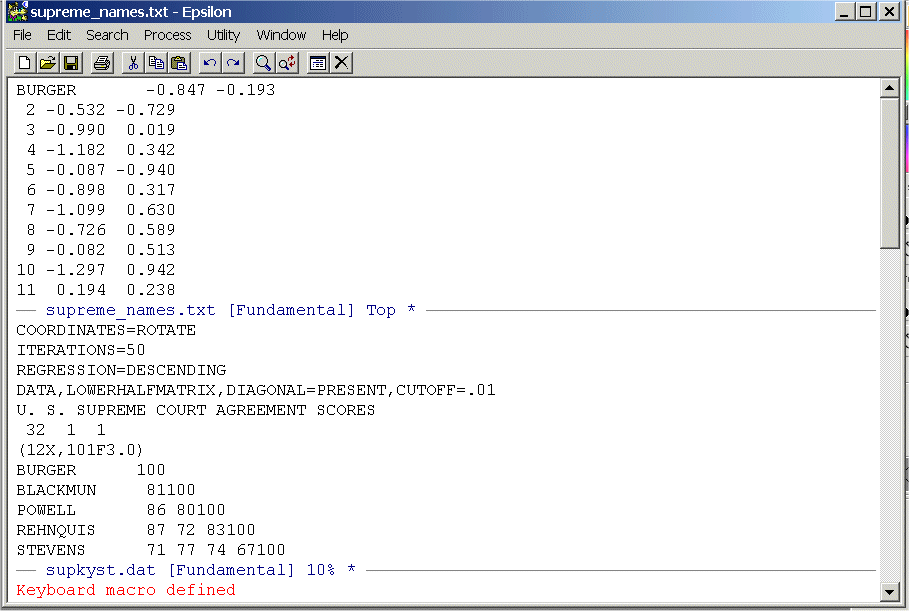
C-X ) This ends the remembering and completes the macro.
You should see:
To execute the macro one time type:
C-X E -- This means "hold the Control key down and type X then type E"
You should see:
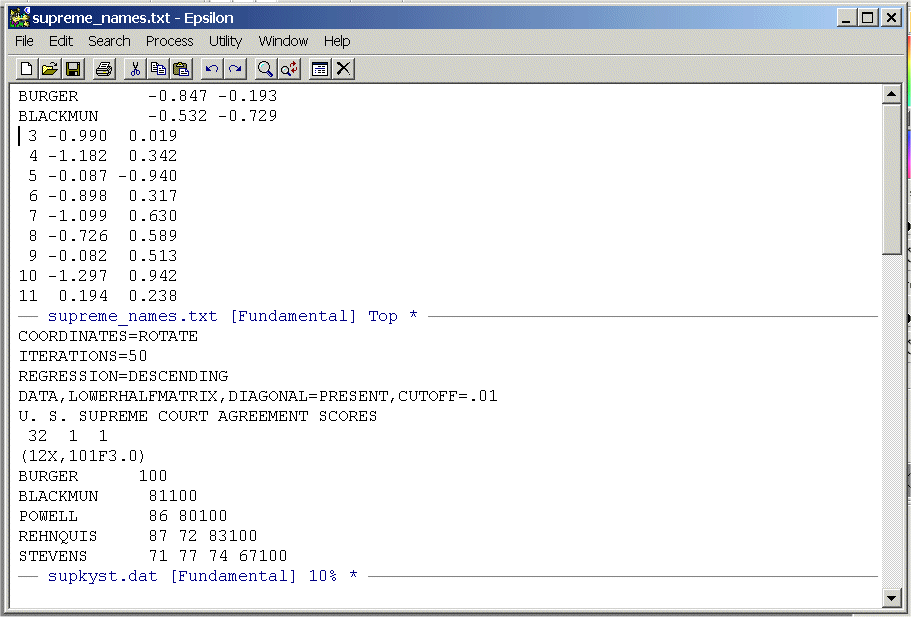
Before executing the macro multiple times it is always good practice to check how many lines there are in the file so that you do not try to go beyond the end of the file (which can have some pretty nasty consequences). To do this type:
C-X L -- This means "hold the Control key down and type X then type L"
You should see:
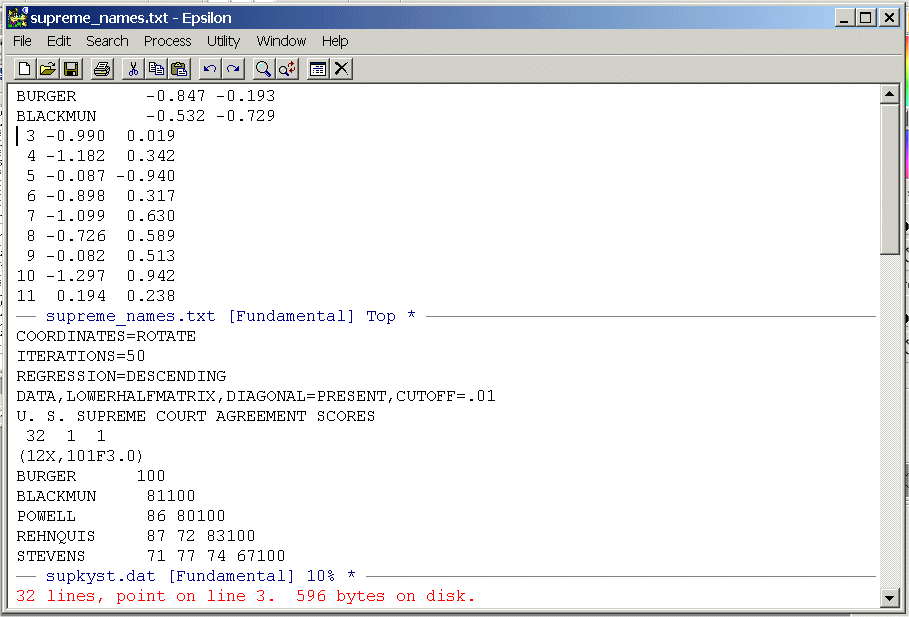
Epsilon tells you that there are 32 lines and the cursor is on line 3. We need to run the macro 30 times but lets execute it only 29 times just to be on the safe side (this is good practice!). To do this type:
C-U -- Control-U. You should see:
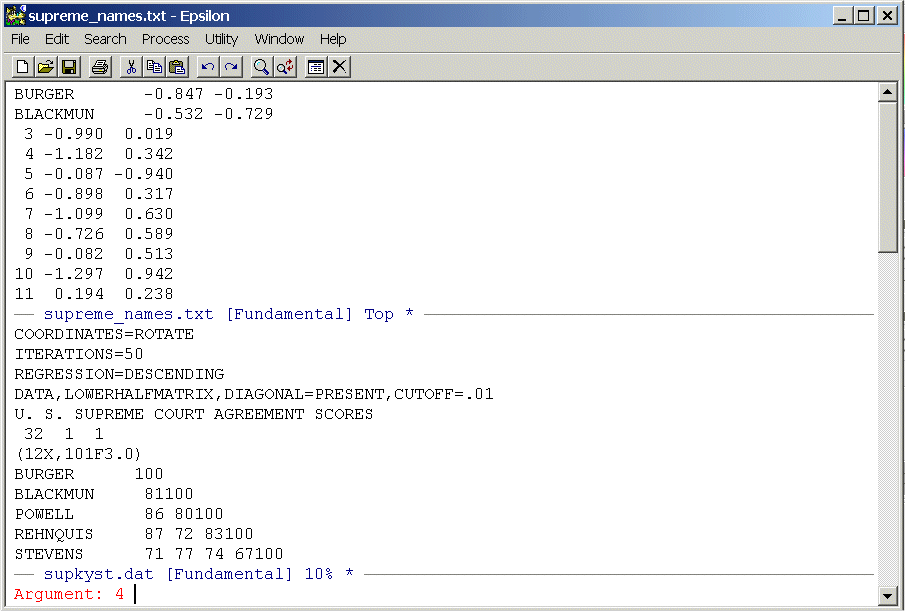
The C-U function will cause whatever command you enter next to be repeated. The "4" is a default. Simply type:
29 C-X E
You should see:
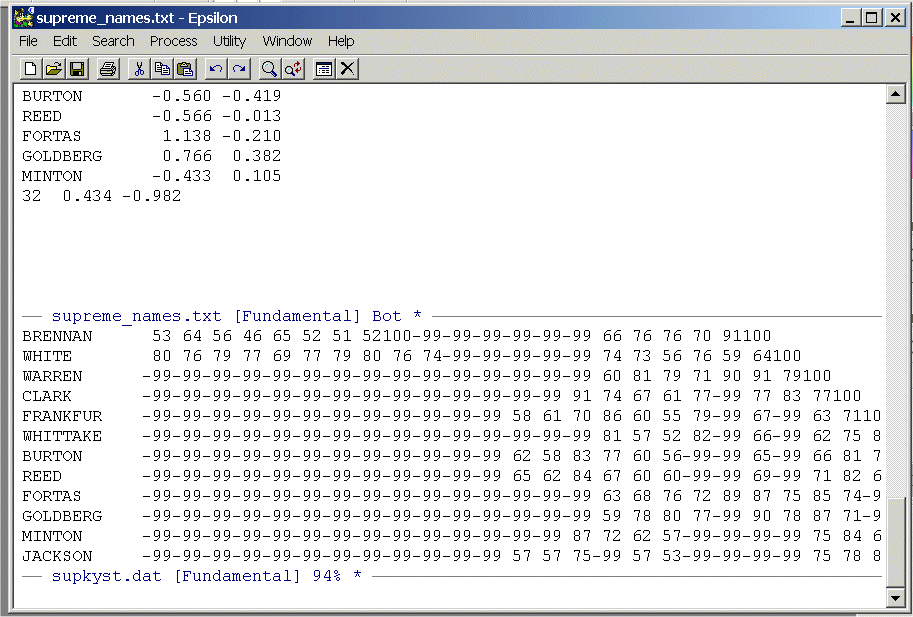
Now, simply execute the macro one more time and you are done:
C-X E
Your cursor should be right below Jackson. We no longer need SUPKYST.DAT so close the lower screen by typing (as described above):
C-X 1
Now save the file in the normal WINDOZE fashion by clicking the floppy token. You can also do this by typing the command:
C-X C-S
Now, place the cursor back at the top of the file. You can do this by simply using the Page-Up but try the command:
ESC < -- This means "hit the Escape key then hit the < (less than) key.
To go to the bottom of the file use the command:
ESC >
To make our graph in R look good we need to change the names in our file from all caps to just the first letter capitalized. Fortunately, Epsilon has a command:
ALT C -- this means "Hit the "ALT" key then hit "C"
If the cursor is placed right before a word like "BURGER" it will change it to "Burger". You can do this for all 32 justices by writing a simple macro:
C-X (
ALT C
C-A
C-N
C-X )
Execute this for all 32 justices and save the file. You should see:
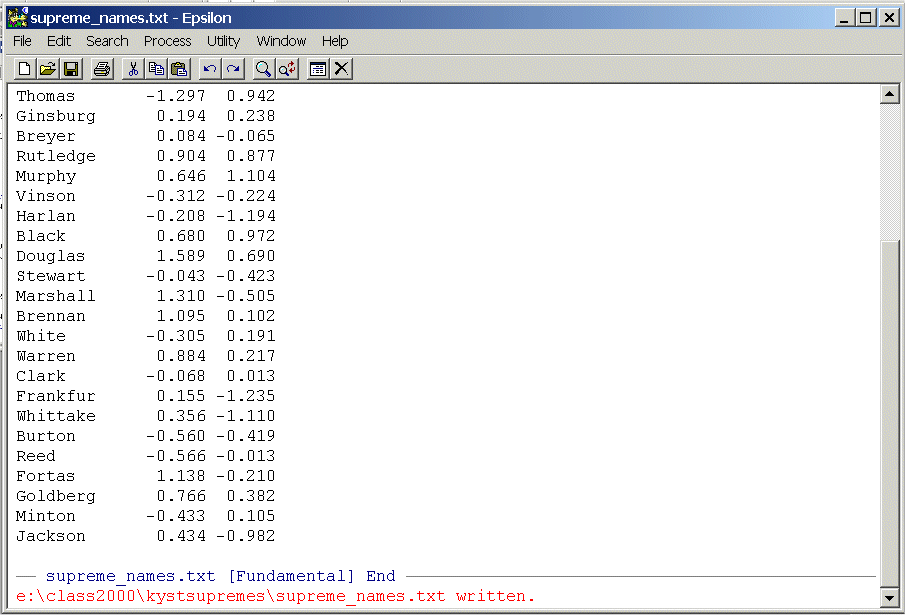
Now exit Epsilon. It will complain because SUPKYST.DAT is still sitting in a buffer and has not been saved. You will see this:
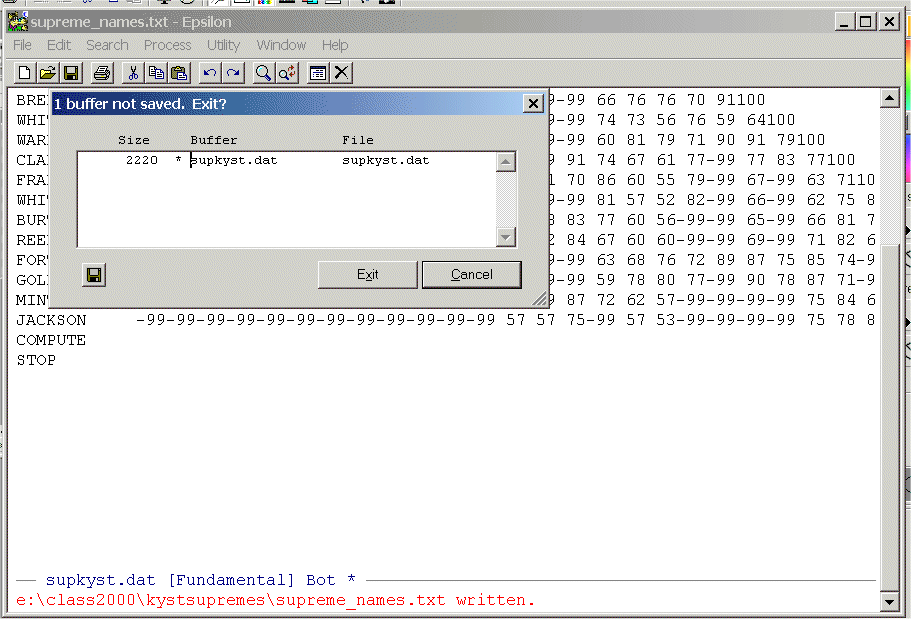
Click on "Exit" and it will flush the altered version of SUPKYST.DAT from its buffer and quit. If you look at SUPKYST.DAT on your disk drive it will be unaltered.
Now, start R
and enter the command:
supremesnames <- read.table("E:/class2000/kystsupremes/supreme_names.txt",header=F,row.names=1)
This tells R to read in the file you just created.
(Be sure to correctly type in the correct path statement!) The "header=F" tells
R that we do not have labels for the
columns and the "row.names=1" tells R that the
first column are row labels. Now type:supremenames
and you should see:
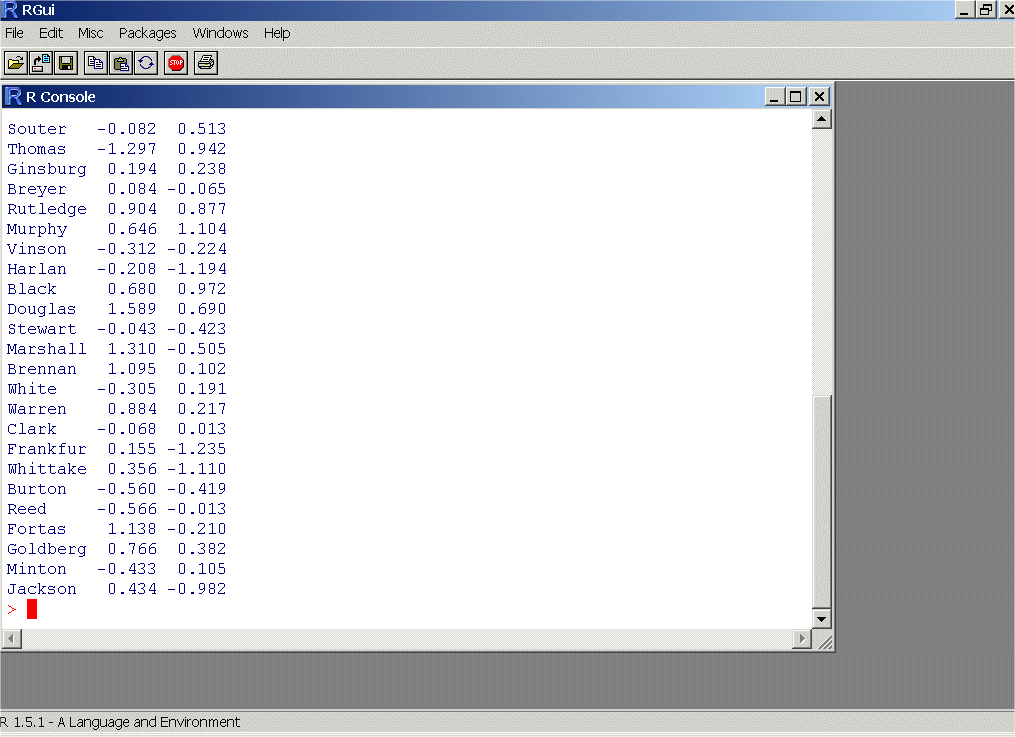
Note that R puts the default headers "V2" and "V3" above the coordinate columns! Now enter the commands:
attach(supremesnames) -- This tells R that you want to work with the columns in "supremesnames"
plot(V2,V3)
text(V2,V3,labels=row.names(supremesnames),adj=0) -- This sticks the names into the plot!
-
Turn in the above plot.
Note that R has chopped off the names on the right side. We can fix this by telling R to change the scale of the axes. To do this enter the commands:
plot(V2,V3,xlim=c(-2,2),ylim=c(-2,2))
text(V2,V3,labels=row.names(supremesnames),adj=0)
Turn in the above plot.
The labels of our axes are lame! Bring up Supreme_names.txt in Epsilon and insert your own column names. To be safe, use something short with no spaces so the file looks something like this:
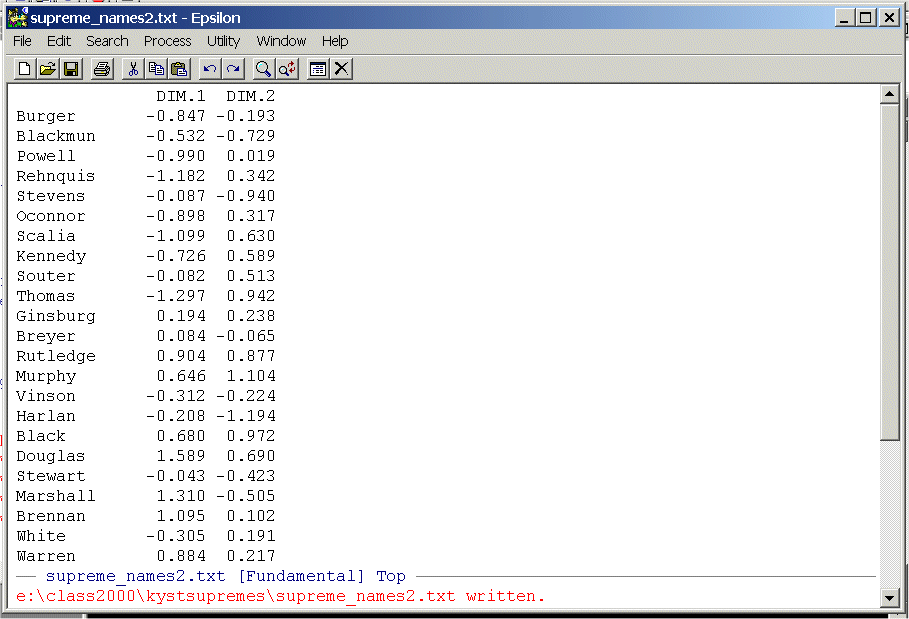
Note that I have saved it as a new file supreme_names2.txt!!
Repeat the steps above only now you need to tell R that you have your own column names. Use the command:
supremesnames2 <- read.table("E:/class2000/kystsupremes/supreme_names2.txt",header=T,row.names=1)
Replicate (a) and (b) above and turn in the plots.In this problem we are going to make a Shepard Diagram (see Borg and Groenen p. 35) for the two dimensional coordinates of the U.S. Map Driving Distance Data. We are going to use the "Printer Output File" for the "REGRESSION=ASCENDING" run you did for 2(b) for homework one. Bring the file up in Epsilon and page down until you are just below the two-dimensional coordinates for the 10 cities. You should see the following:
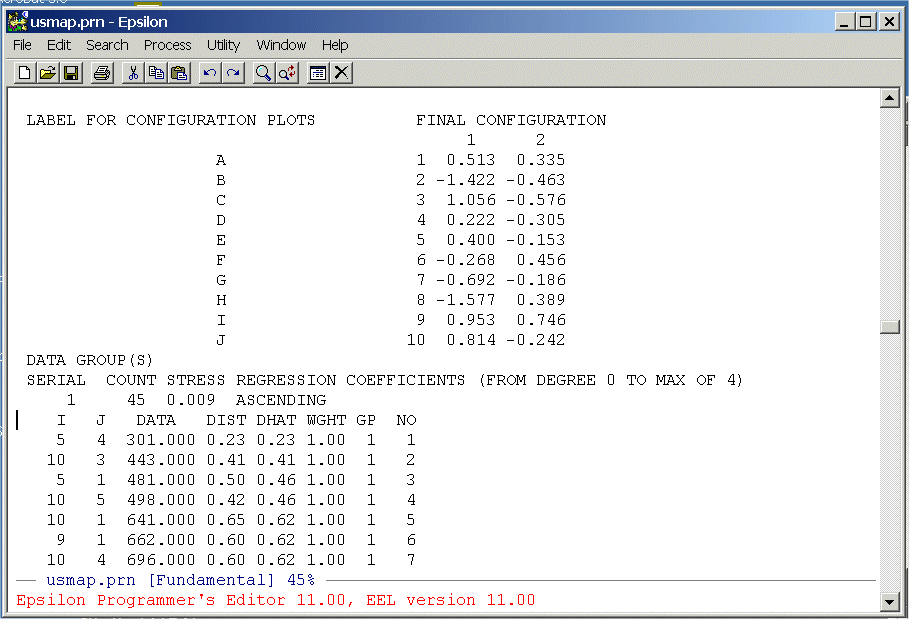
The columns we need are below the labels "DATA", "DIST", and "DHAT". We are going to extract these from the file and write them to a text file that we can then read into Excel. To do this we are going to write a simple Epsilon macro. First, split the screen:
C-X 2
Now use the
C-X C-F
command to get an empty file -- junk.txt. You should see:
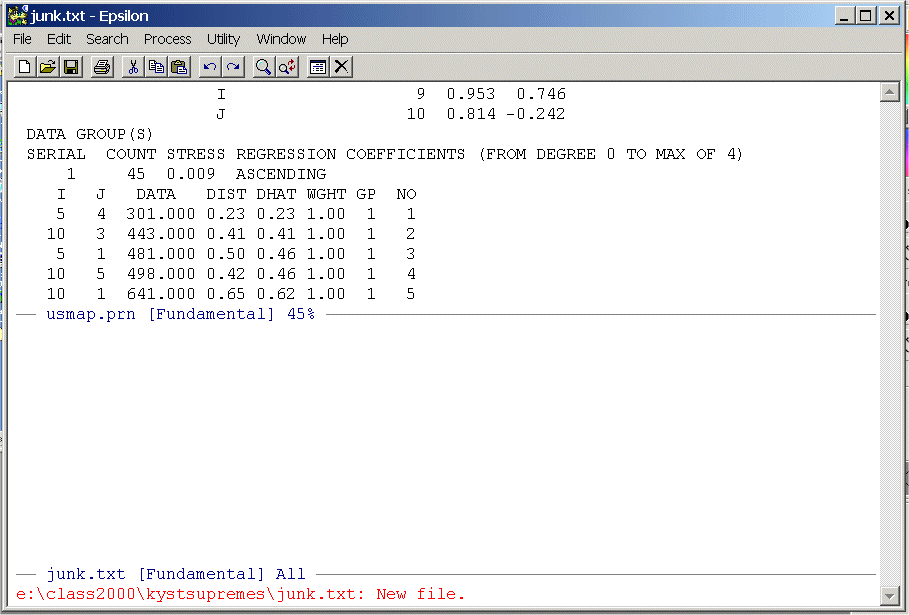
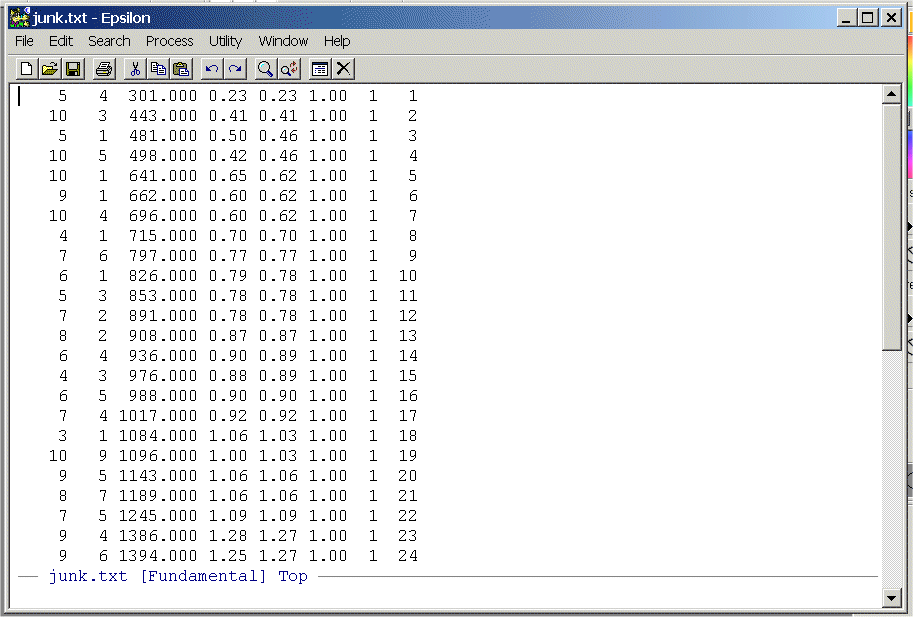
Highlight the data from the line below the labels on down -- there will be 45 rows -- and put it on the clipboard. Now close the upper window (C-X 0), paste it into junk.txt, save junk.txt, and position the cursor at the top of the file. You should see:
-
Write a simple Epsilon macro to
remove the first two columns and the last three columns. List your commands
and turn them in.
Read junk.txt into Excel and produce a plot of "DATA" (horizontal axis) against "distances" (vertical axis). Use the "XY (Scatter)" option to make the graph. After you have the points plotted, try fitting a line through the points. Under the "Chart" option select "Add Trendline" and you should see something like this:
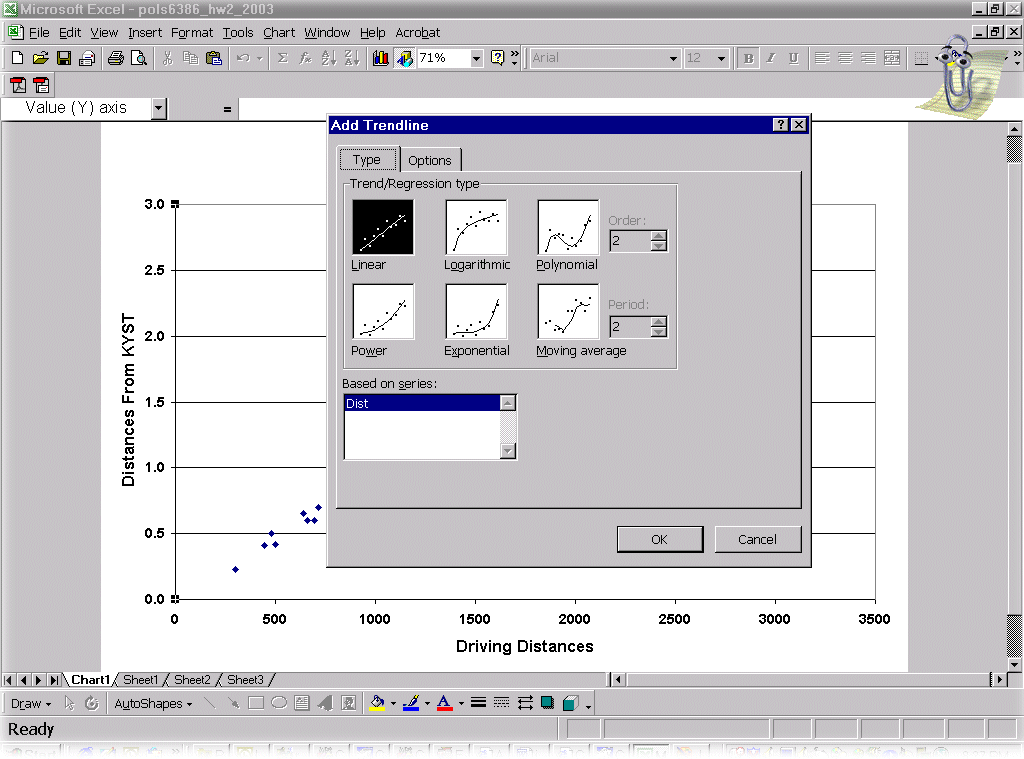
Before trying to fit a line, go to the options tab and select "Display Equation on Chart" and "Display R-Squared Value on Chart." You should see this:
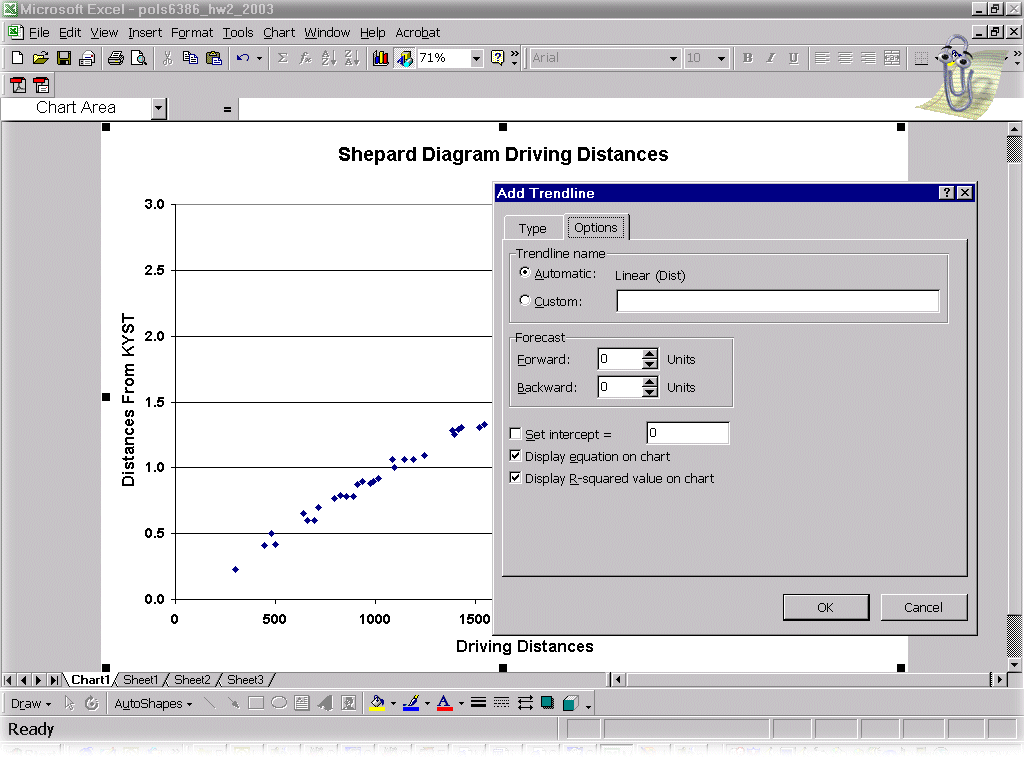
If you do not like the result simply right-click on the line and select "Clear". You can then try another type of line. Note that WINDOZE requires you to do the options tab all over again! (Sorry about that!)
Turn in the graph.
Make another plot showing "DATA" (horizontal axis) against "D-Hats" (vertical axis). Fit a line and turn in the graph.
Paste your Excel file into Stata and replicate the two models fitted in (b) and (c). Turn the logging function on in Stata and paste the regression tables into the homework. Also report the results for the d and summ commands. All variables should be properly defined as we discussed in class. For an example of how to paste an Excel spreadsheet into Stata check out the First Homework Assignment Advanced Multivariate Analysis.