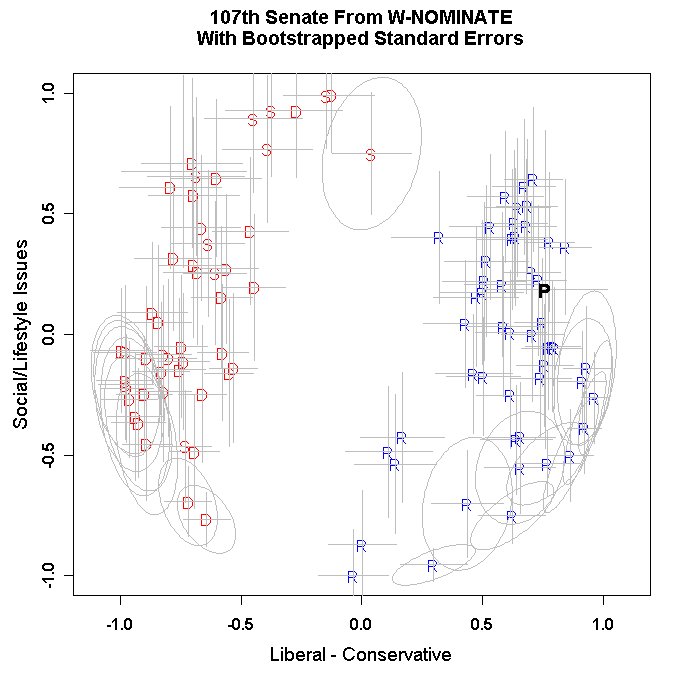
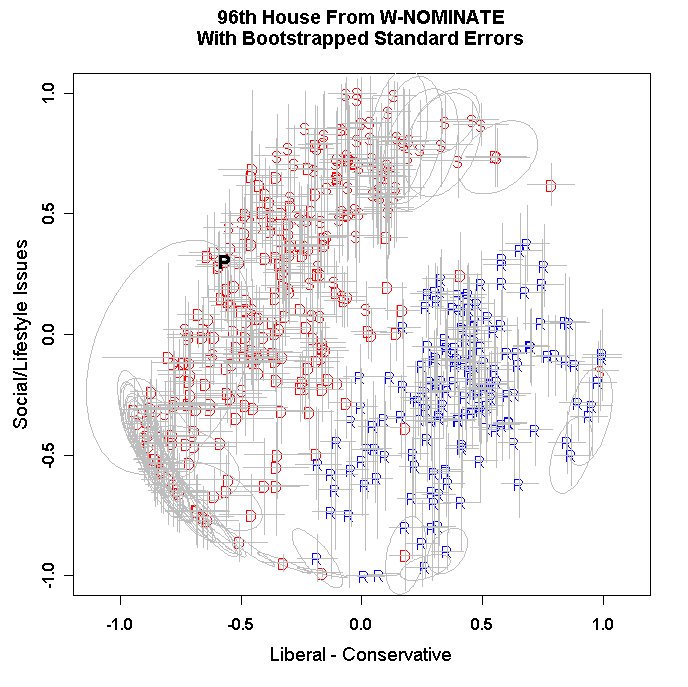
W-NOMINATE Parametric Bootstrap Program
Jeff Lewis and Keith Poole
(Updated 24 October 2006)
Examples
SEN107KH.ORD               Data File Name -- can include path statement
NOMINAL MULTIDIMENSIONAL UNFOLDING OF 107th SENATE  Title of Run
  633   10   18            Number RCs, Left on 1st, Up on 2nd
    2   36 1001            Number Dimensions, Number Characters to Read From Header, Number of Bootstrap Trials
 15.0000  0.5000           Starting Values for BETA and WEIGHT
  0.0250   20              RC Min. Cutoff, Number RCs for Legislator
(36A1,3600I1)              Format for Roll Call File
(1X,I4,36A1,1X,4I4,51F7.3) Format for Legislator Coordinate File -- NOM31.DAT
(1X,I4,36A1,80F10.4)       Format for W-NOMINATE, H-S, and Metric Coordinate File -- NOM36.DAT --
                           and FORT.26 -- The Parametric Bootstrap Legislator Coordinates and Standard Errors
006330001000018
and
000020003601001
This spacing must not be changed! If you want to analyze 1221 roll calls in 3 dimensions with everything else the same the two lines must look like this:
012210001000018
000030003601001

or with the zeroes removed

 1221   10   18
    3   36 1001
Although in this setup we have the number of bootstrap trials set to 1001 we
recommend that the user set this to either 11 or 6 (00011 or 00006) initially
and study the output files before doing a large number of trials.
   1 1079991099 0USA     20000BUSH           0.7605    0.1849    0.8266    0.1409    0.1312    0.3363    1.0000   -0.0440   -0.0440    1.0000
   2 1074970041 0ALABAMA 20001SESSIONS       0.6413   -0.4361    0.6926   -0.4954    0.0758    0.1152    1.0000    0.0533    0.0533    1.0000
   3 1079465941 0ALABAMA 20001SHELBY         0.5048   -0.1749    0.5646   -0.2032    0.0784    0.1246    1.0000    0.0532    0.0532    1.0000
   4 1071490781 0ALASKA  20001MURKOWSKI      0.6319    0.4609    0.6786    0.4407    0.0707    0.1546    1.0000    0.0646    0.0646    1.0000
   5 1071210981 0ALASKA  20001STEVENS        0.5176    0.3038    0.5899    0.3249    0.0887    0.1598    1.0000    0.0395    0.0395    1.0000
                                  etc etc etc
         The first column is an integer counter
         The column in red is the Congress number
         The column in blue is the ICPSR ID Number
         The column in Magenta is the ICPSR State Code
         The column of zeroes will show the two digit Congressional District Number for House Roll Call Matrices
         The column in Coral is the first seven letters of the State Name
         The column in Midnightblue is the party code -- see the Party Codes Page for a complete listing
         The column in Firebrick are the ICPSR Occupancy and Election Codes
         Name of Senator/Representative
         The columns in Turquoise are the W-NOMINATE Coordinates.
         The columns in Purple are the Mean Coordinate Values For the 1000 Trials
         The columns in Green are the Parametric Bootstrapped Standard Errors
         The last four columns are the Pearson Correlation Matrix between the two dimensions.  The column
           in Deeppink is the Pearson Correlation Between the First and
                  Second Dimension Coordinate estimates across the 1000 Bootstrap Trials
                  This can be used to obtain the corresponding covariance term
                                  etc etc etc
  98 1071492256 0WEST VI 10001ROCKEFELLER   -0.7407   -0.1129   -0.7197   -0.1616    0.0551    0.1440    1.0000   -0.0500   -0.0500    1.0000
  99 1074930925 0WISCONS 10001FEINGOLD      -0.7206   -0.6933   -0.7128   -0.6586    0.0497    0.0739    1.0000   -0.3755   -0.3755    1.0000
 100 1071570325 0WISCONS 10001KOHL          -0.5807    0.1534   -0.5395    0.0984    0.0638    0.1491    1.0000    0.0402    0.0402    1.0000
 101 1074970668 0WYOMING 20001ENZI           0.7769    0.3826    0.7873    0.3420    0.0529    0.1471    1.0000    0.1047    0.1047    1.0000
 102 1071563368 0WYOMING 20001THOMAS         0.8422    0.3621    0.8374    0.3115    0.0555    0.1420    1.0000    0.0080    0.0080    1.0000

HOU96KH.ORD                Data File Name -- can include path statement
 NOMINAL MULTIDIMENSIONAL UNFOLDING OF 96TH HOUSE   Title of Run
 1276    1    4            Number RCs, Left on 1st, Up on 2nd
    2   36 1001            Number Dimensions, Number Characters to Read From Header, Number of Bootstrap Trials
 15.0000  0.5000           Starting Values for BETA and WEIGHT
  0.0250   20              RC Min. Cutoff, Number RCs for Legislator
(36A1,15000I1)             Format for Roll Call File
(1x,I4,36A1,1X,4i4,51f7.3) Format for Legislator Coordinate File -- NOM31.DAT
(I4,1X,36A1,80F10.4)       Format for W-NOMINATE, H-S, and Metric Coordinate File -- NOM36.DAT --
                           and FORT.26 -- The Parametric Bootstrap Legislator Coordinates and Standard Errors
The file with the bootstrapped standard errors for the 96th House
looks something like this (these are random draws so your results may be slightly different):
   1  969990699 0USA     10000CARTER        -0.5675    0.3060   -0.5532    0.2532    0.0613    0.1204    1.0000    0.0202    0.0202    1.0000
   2  961072141 1ALABAMA 20001EDWARDS J      0.2690    0.1142    0.2553    0.1208    0.0352    0.0650    1.0000   -0.0539   -0.0539    1.0000
   3  961071741 2ALABAMA 20001DICKINSON      0.5833    0.2121    0.5709    0.2402    0.0376    0.0787    1.0000    0.0011    0.0011    1.0000
   4  961103741 3ALABAMA 10001NICHOLS        0.1722    0.8014    0.1331    0.8823    0.0536    0.1140    1.0000    0.2858    0.2858    1.0000
   5  961100041 4ALABAMA 10001BEVILL  T     -0.0197    0.9998   -0.0387    0.9896    0.0404    0.0288    1.0000    0.0220    0.0220    1.0000
                                  etc etc etc
         The first column is an integer counter
         The column in red is the Congress number
         The column in blue is the ICPSR ID Number
         The column in Magenta is the ICPSR State Code
         The column of zeroes will show the two digit Congressional District Number for House Roll Call Matrices
         The column in Coral is the first seven letters of the State Name
         The column in Midnightblue is the party code -- see the Party Codes Page for a complete listing
         The column in Firebrick are the ICPSR Occupancy and Election Codes
         Name of Senator/Representative
         The columns in Turquoise are the W-NOMINATE Coordinates.
         The columns in Purple are the Mean Coordinate Values For the 1000 Trials
         The columns in Green are the Parametric Bootstrapped Standard Errors
         The last four columns are the Pearson Correlation Matrix between the two dimensions.  The column
           in Deeppink is the Pearson Correlation Between the First and
                  Second Dimension Coordinate estimates across the 1000 Bootstrap Trials
                  This can be used to obtain the corresponding covariance term
                                  etc etc etc
 436  961467525 6WISCONS 20002PETRI          0.3170   -0.7953    0.3135   -0.8778    0.0364    0.1007    1.0000   -0.2289   -0.2289    1.0000
 437  961203625 7WISCONS 10001OBEY  D       -0.6867   -0.3093   -0.7381   -0.3129    0.0691    0.0635    1.0000   -0.0703   -0.0703    1.0000
 438  961465525 8WISCONS 20001ROTH  T        0.5172   -0.3872    0.5164   -0.4095    0.0351    0.0735    1.0000   -0.0470   -0.0470    1.0000
 439  961465725 9WISCONS 20001SENSENBRENN    0.6537   -0.6186    0.6562   -0.6479    0.0394    0.0712    1.0000   -0.1445   -0.1445    1.0000
 440  961461168 1WYOMING 20001CHENEY  R      0.5594   -0.1952    0.5585   -0.1939    0.0352    0.0710    1.0000   -0.0249   -0.0249    1.0000
