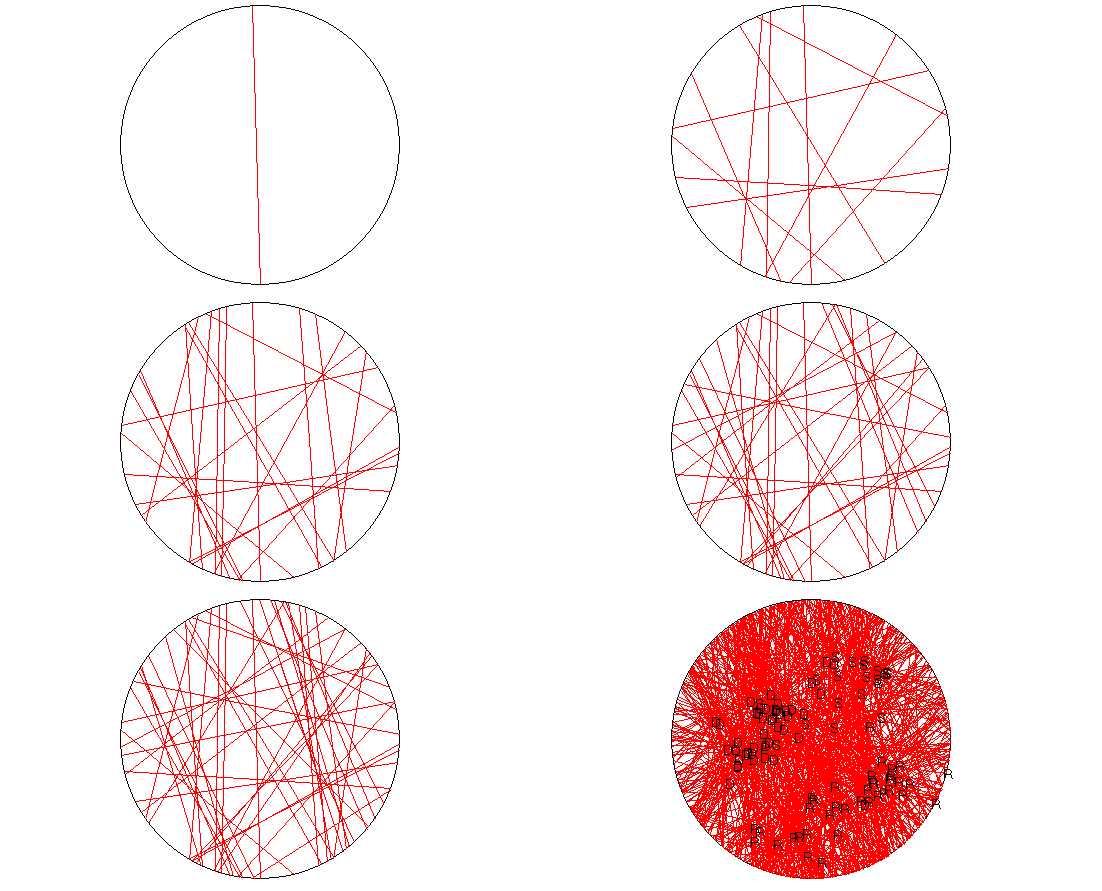
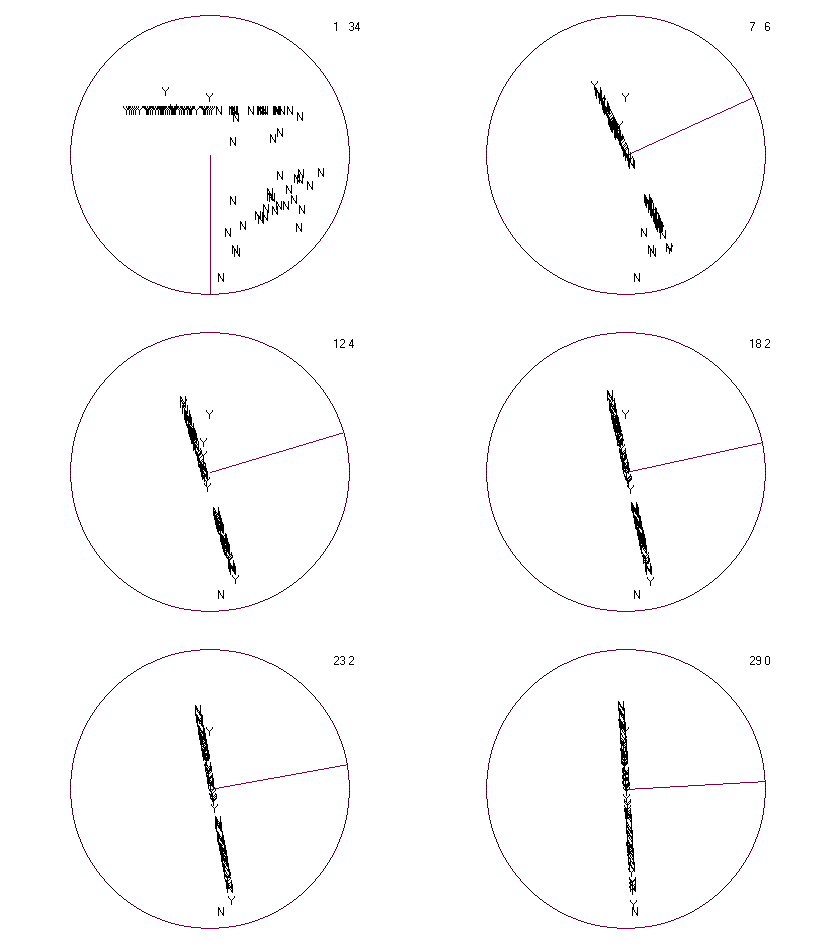
Optimal Classification Scaling is a general non-parametric unfolding technique for maximizing the correct classification of binary choice data. Simply put, in the context of roll call voting, what the program does is find points representing the legislators and planes representing the roll calls so as to maximize the number of correctly classified choices. The unfolding technique is non-parametric because the only assumptions made are that the choice space is Euclidean and that individuals making choices behave as if they utilize symmetric, single-peaked preferences. Other than these assumptions, no assumptions are made about the functional form of individuals' preferences and no assumptions are made about the distributional form of individuals' errors in making choices. The motivation for and the primary focus of the unfolding technique is parliamentary roll call voting data but the procedures that implement the unfolding also can be used to solve the problem of unfolding rank order data.
A roll call vote in a legislative assembly using standard parliamentary rules consists of each legislator casting a Yes (Yea) or No (Nay) vote on the motion on the floor. Typically, if the motion fails the status quo prevails. Consequently, each roll call vote can be considered to be a choice between two policy outcomes - one corresponding to Yea and one corresponding to Nay. Because legislators are assumed to have symmetric single-peaked preferences around their ideal points, if there were no error they would vote for the alternative closest to them in the policy space on any roll call.
If voting was "perfect" -- that is, the legislators make no errors -- and the policy space was two dimensional, then the roll call vote will look like the figure below:
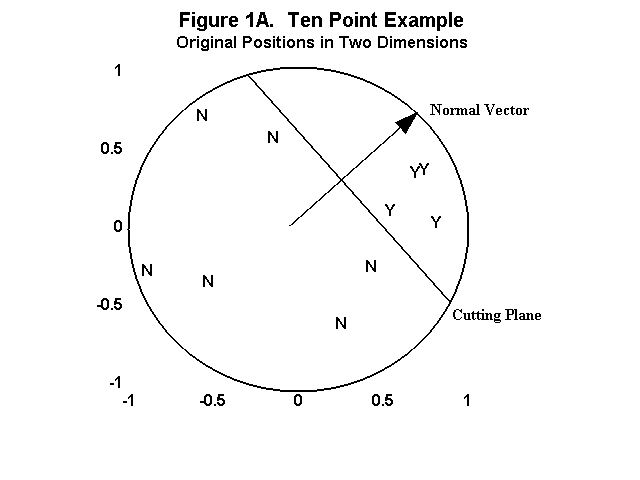
In the perfect case in two dimensions, a line that is both perpendicular to the line joining the Yea and Nay policy points and passes through the midpoint of the Yea and Nay policy points, separates the legislators voting Yea from the legislators voting Nay. This line is called a cutting line. In three or more dimensions this will be a cutting plane. Technically, if there are s dimensions, then a plane is defined as
z'n = v'n
where z, n, and v are s by 1 vectors and the plane consists of all points z such that (z - v) is perpendicular to the normal vector, n, and v is some point in the plane.
In the figure above, the normal vector to the cutting line is perpendicular to the cutting line and parallel to the line joining the Yea and Nay policy points! Note that, in the case of perfect voting, the policy points are not identified - any pair of points on a line perpendicular to the plane that are on opposite sides and equidistant from the plane would produce the same pattern of votes.
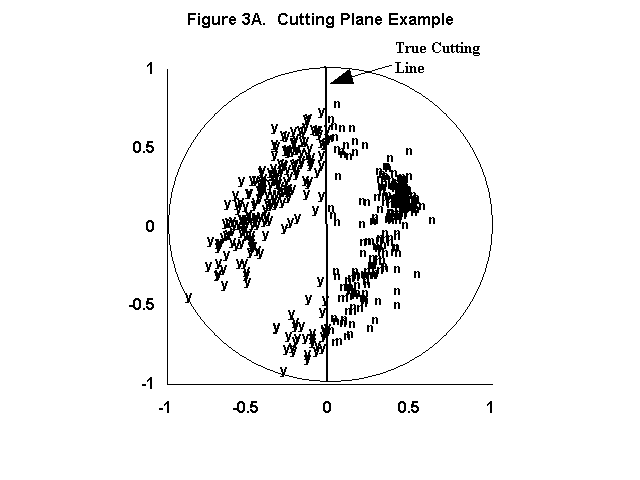
Below is another example of perfect voting in two dimensions using the actual configuration of legislators from the 80th House. Note that, even though the Yea and Nay policy points are not identified, the cutting line in this example is far more precisely located than in the first figure where there is a considerable amount of "wiggle room" between the legislators.
Finding the Optimal Cutting Line
First, given a set of chooser or legislator points a cutting plane must be found such that it divides the legislators/choosers into two sets that reproduce the actual choices as closely as possible.
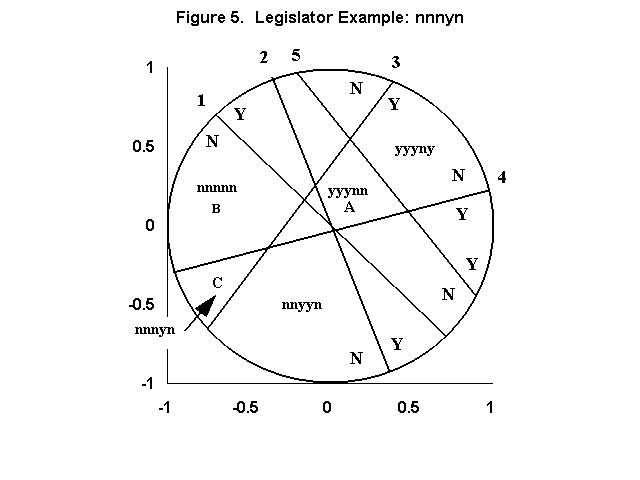
However, the cutting plane is identified. Hence this is an unfolding which recovers points representing the legislators and implicitly pairs of points for each roll call vote albeit only in the form of the cutting planes which pass between the pairs of points. A plane is defined as z¢n = v¢n where z, n, and v are s by 1 vectors and the plane consists of all points z such that (z - v) is perpendicular to the normal vector, n, and v is some point in the plane. If V is a p by s matrix of points all laying on the plane then Vn = Jpc (1) Where Jp is a p length vector of ones and c is a constant. If the plane passes through the origin of the space, then c is equal to zero. In this context, the problem is to solve for the normal vector, n. (Given n, as shown below, it is simple to find the point on n through which the plane passes.) Let N be the q by s matrix of normal vectors for the q cutting planes. Given the number of dimensions, s, the classification problem consists of finding estimates of X and N, denoted as X* and N* respectively, which maximize the correct classifications. In sum, only two basic assumptions are made: 1) the choice space is Euclidean; and 2) the individuals making choices behave as if they utilize symmetric, single-peaked preferences. Consequently, given a matrix of roll calls, the non-parametric unfolding problem consists of finding a set of legislator points and a set of cutting planes corresponding to each binary choice in an Euclidean space of s dimensions such that each cutting plane divides the legislators into two sets that reproduce the actual choices as closely as possible. In one dimension this consists of finding a joint rank ordering of the legislators and roll call midpoints (ties are permitted, an example is shown in Table 7 below) that maximizes correct classification. Given a rank order of legislators, the global maximum in classification can be found for every roll call. Similarly, given a rank order of the roll call midpoints, the global maximum in classification can be found for every legislator. The two are symmetric in one dimension. In two or more dimensions this symmetry disappears. For example, in two dimensions, q cutting lines create a maximum of q(q-1)/2 + q + 1 regions (Coombs, 1964, p. 262) with each region corresponding to a voting pattern - e.g., yynnynyn…nn - on the q roll calls. The problem is to place each legislator in a region that best matches the legislator's observed pattern of roll call votes. Given the legislator points, the problem is to find a cutting line for each roll call that divides those legislators voting Yea from those voting Nay such that correct classification is maximized. Solutions for these two problems are shown in the next two sections. When the number of legislators is 100 or greater and the number of roll calls is on the order of 500 - typical of national legislatures, for example, the U.S. Senate - then the recovery of the legislators and cutting lines is very precise. With 500 roll calls, there are a maximum 125,251 regions in two dimensions and over 20,000,000 in three dimensions. Most of these regions are so small that a typical legislator's point is very precisely pinned down. In fact the recovery of the legislator coordinates is virtually identical to those recovered by parametric procedures that must make strong assumptions about the interpersonal comparability of individuals' utility and the function form of the error distribution (e.g., Heckman and Snyder, 1997; Poole and Rosenthal, 1997). Sections 2-4 develop the non-parametric unfolding procedure. Section 2 shows a solution for finding the optimal cutting plane given a configuration of legislators, section 3 shows a solution for finding the optimal legislator point given a set of cutting planes, and section 4 shows Monte-Carlo tests of the unfolding procedure. Empirical applications are shown in Section 5.
